Level up with the 2023 Factbook!
Access the Factbook online!
Have you read this year's Factbook? If not, you can go to autocare.org/factbook. Members get free access - if you're a member and this is your first time accessing it online, you can create login credentials going to autocare.org/register to access and navigate it online.For a great tutorial on how to do this, watch our webinar on the Factbook - Nathaly Branham, our director of web and digital experience, outlines all the steps required to access and navigate this year's edition. Members may watch the webinar here
Choose your own adventure!
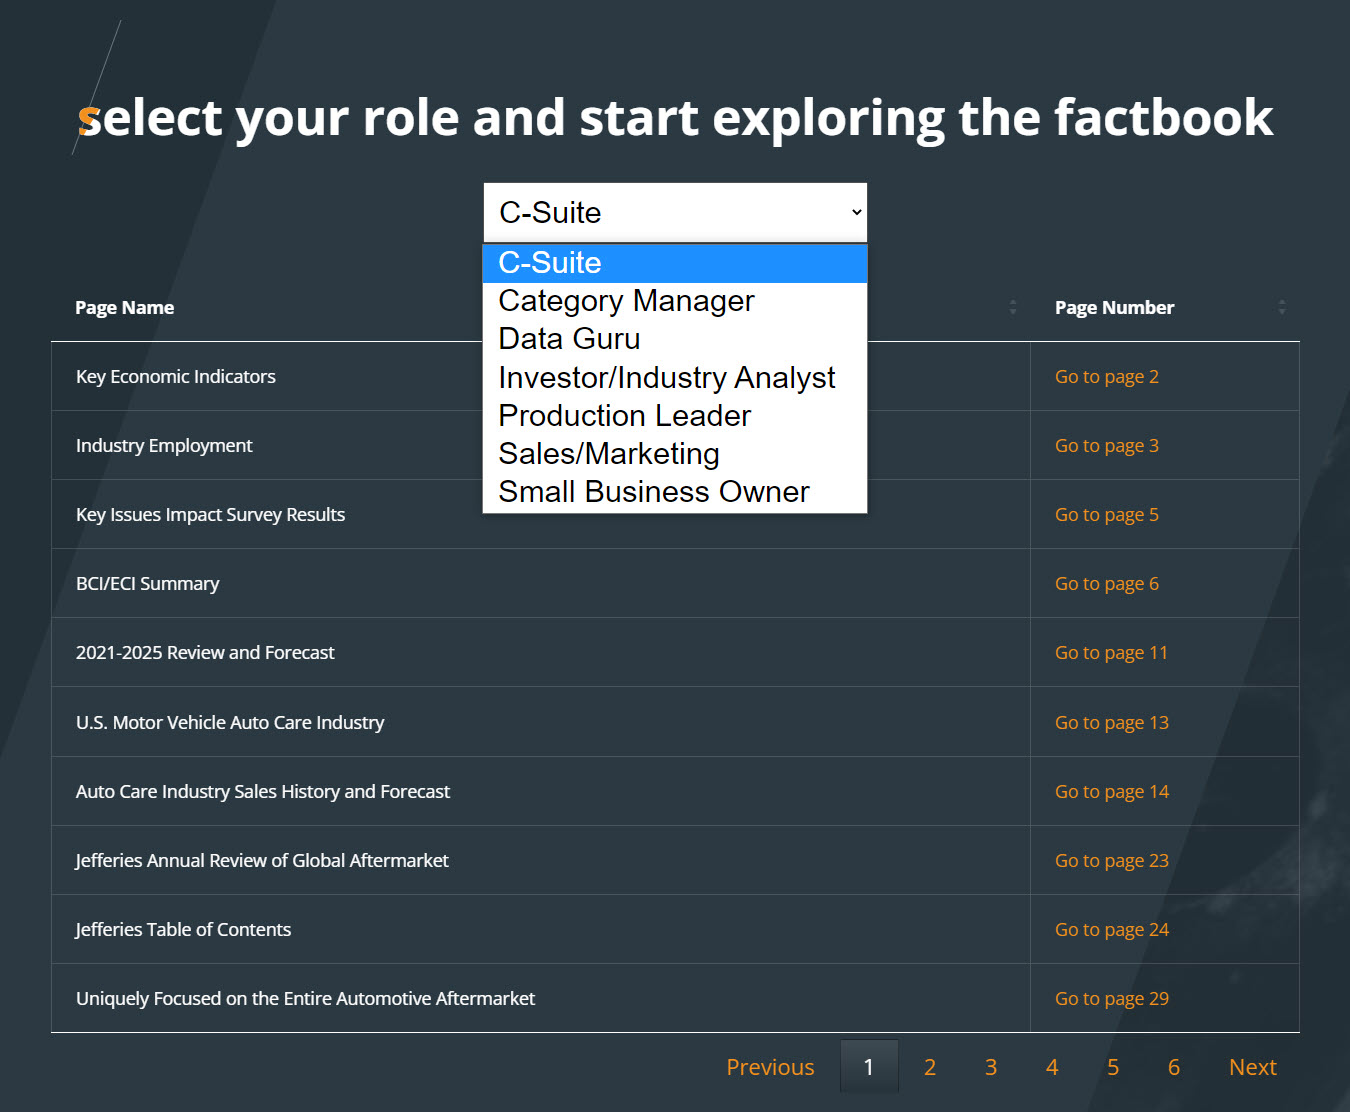
Not sure where to start? Totally understandable given the volume of content and the variety of roles our members have. Nathaly created a guide for a few different audiences - marketing/sales, C-suite, production managers, small business owners, data gurus - you can find curated guides to selected pages.
Connect the dots!
Two of the headline figures are market size and miles driven - let's start there:
Some of the developments over the past few years relate to changing driving behavior and electric vehicle adoption. Let’s dig into these a bit and jump around the Factbook for related data.
Vehicle population
Based on S&P Global Mobility registration data, there are
292.2 million total vehicles
(283 million light) as of January 1, 2022
up 1.3% from 2021 (Factbook page 114)
Alternative powertrain registrations – hybrid electric, plug-in hybrid electric, battery electric, and fuel cell – have increased incrementally up to 2020 (3-5% per year) before inflecting upward to
9.4% of vehicles sold in 2021
(Factbook page 118)
What might that mean for parts?
THOUGHT STREAM 1
EV parts replacement
How many miles does the average EV take on?
We have some stats on that – generally speaking, about 1,000 miles/month based on S&P Global Mobility data (Factbook page 119).
How many battery and drive motor parts have been installed on electric and hybrid vehicles?
This year’s edition includes the number of units installed on electric and hybrid vehicles at OE dealerships for select part terminologies by vehicle model year. This is a new feature for this year’s edition and represents about 20% of U.S. dealerships. A few of the 48 parts listed include battery cables, battery vent tubes, drive motor battery pack chargers, drive motor inverter brackets, drive motor battery pack gaskets, and hybrid electric motor wiring harnesses (Factbook pages 121-122).
What about DIY/DIFM between gas-powered, hybrid, and electric vehicles And replacement rates between these drive types?
IMR Inc. provides an overall breakdown of new car dealer selection for these propulsion types based on its monthly tracking survey of consumers on vehicle maintenance (Factbook page 120).
And replacement rates for electric vehicle parts?
Similarly, IMR compares replacement rates between all, electric, hybrid and gas-powered vehicles for 20 parts/service (Factbook page 120).THOUGHT STREAM 2
Brakes and accidents
Driving patterns have changed – different commuting patterns. Members can watch this webinar presented by Arity, a wholly owned subsidiary of The Allstate Corporation, to learn more about consumer trends and the potential impact on parts and service purchase.

As you’ll learn in the video, hard braking events vary across cities, along with mileage and congestion throughout the day, implying different impacts on vehicle service and maintenance from city to city.
Has there been an impact on collision rates?
Based on Arity’s telematics data, we have added a chart with the inferred monthly rate of high-impact collisions (normalized by miles driven) (Factbook page 105). We expect this data to be informative for parts manufacturers and paint and body repair shops.
Speaking of which, this year’s Factbook includes expanded collision data – by quarter, the average total gross cost of a vehicle repair estimate, portion attributable to labor vs. parts, percentage of aftermarket, recycled, and remanufactured parts (Factbook page 104).
There are so many use cases for the Factbook – take some time to explore it and find different ways to connect the dots to inform your strategy and operations.
Errata/Clarifications
- On page 47, the 2020-2025 e-commerce CAGR is 9.2%, not 14%
- On page 82, the 19.4% return rate for automotive parts via e-commerce is based on a limited sample size and will be the subject of further study. We will have updates on this statistic in a future Market Insights article and in our upcoming Joint E-Commerce Trends Study at AAPEX in November.
Takeaways
Get the 2023 Factbook: Access your copy of the 2023 Factbook by going to autocare.org/factbook. The report is available for all members and available for purchase by non-members.
Explore by job role: Visit autocare.org/factbookbyrole to select your role and start exploring the factbook.
Access TrendLens: Learn more about TrendLens and glean industry insights from Auto Care's exclusive interactive data platform at trendlens.autocare.org.

Michael Chung, Director, Market Intelligence
Ready to dive into market research? I provide the industry with timely information on key factors and trends influencing the health of the automotive aftermarket and serving as a critical resource by helping businesses throughout the supply chain to make better business decisions. More About Me

Market Insights with Mike is a series presented by the Auto Care Association's Director of Market Intelligence, Mike Chung, that is dedicated to analyzing market-influencing trends as they happen and their potential effects on your business and the auto care industry.
More posts
Content
-
[WATCH] Driver Behavior Trends and Their Impact on Parts and Service Opportunities
March 17, 2022This webinar analyzes driving behavior at the national, state, and local levels. Gain insights into: consumer behavior; driving patterns; and potential impacts on parts replacement, service and repair scheduling, vehicle age, and the car parc.
-
[WATCH] 2022 Business Outlook: Top Emerging Opportunities and Challenges
February 4, 2022This webinar explores need-to-know emerging opportunities and challenges for the coming year: current status of supply chain issues and what to expect in the year ahead and more.
-
[WATCH] How to Use Vehicle Miles Traveled to Better Your Bottom Line in 2022
December 3, 2021Vehicle Miles Traveled has been respected for years as a key indicator of aftermarket opportunities. Historically, planning has been limited to directional indicators but now aftermarket businesses can leverage more detailed insights on geographic differences as well as vehicle differences to more effectively take advantage of aftermarket opportunities.


