TrendLens®: Interactive Data
Interactive automotive aftermarket industry insights at your fingertips
Use TrendLens data platform, exclusively available to you as an Auto Care member, to understand how market influencing factors are affecting the industry and your business.
Including Arity Vehicle Miles Traveled data published just days following the end of the month or week prior.
What's Included
Exclusively for our members, TrendLens brings the latest economic and industry data together to help inform your business decisions with current, curated and interactive data. Critical to illuminate a COVID-impacted economic landscape, the TrendLens team put the project into hyperdrive this year and has continually improved the TrendLens flagship dataset – the Demand Index.

40+ Economic Indicators
More than 40 expertly curated Economic and Industry Indicators available free to members.

Live Miles Driven
Why wait to know changes in Vehicle Miles Traveled (VMT)? See the most updated data now from Arity on TrendLens.

Market View
The package provides your organization access to Weekly VMT data by Arity, and the ability to download reports or data—so you can crunch and compare the numbers on your own.

Watchlist
Cutting-edge visualization and essential watchlist alerts to make TrendLens™ more powerful for users.

Pearson’s Correlation Coefficient
Automatically view the correlation value to see the potential relationship between the two variables.
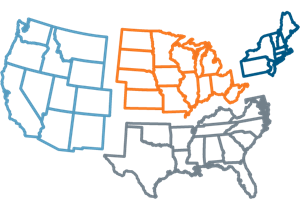
Regional Demand Index and Economic and Industry Data
Dive deeper with Regional Views with 4 distinct regions, dissect trends beyond the national view.

Live Data
Industry-leading Factbook data comes to life with live and always up-to-date data now in TrendLens.

Demand Index
Demand Index helps aftermarket companies know how their products are performing against the market.

See How It Works
View quick tutorials on how to make the data in TrendLens help you make better business decisions today.

Why wait to know changes in Vehicle Miles Traveled (VMT)? See the most updated data now from Arity on TrendLens.

The package provides your organization access to Weekly VMT data by Arity, and the ability to download reports or data—so you can crunch and compare the numbers on your own.
Subscribe Today
Cutting-edge visualization and essential watchlist alerts to make TrendLens™ more powerful for users.

Automatically view the correlation value to see the potential relationship between the two variables.
Dive deeper with Regional Views with 4 distinct regions, dissect trends beyond the national view.

Industry-leading Factbook data comes to life with live and always up-to-date data now in TrendLens.
Demand Index helps aftermarket companies know how their products are performing against the market.
See More

View quick tutorials on how to make the data in TrendLens help you make better business decisions today.
View Tutorials
Economic and Industry Indicators
- Aftermarket Employment (000s)
- Auto Care/NU Business Confidence Index
- Auto Care/NU Economic Confidence Index
- Auto Parts, Accs. & Tire Stores Sales ($M)
- Automotive Maintenance & Repair Employment (000s)
- Avg. Hourly Wages - Automotive Maintenance & Repair
- Avg. Hourly Wages - Parts Mfg. Employees
- Avg. Hourly Wages - Parts Store Employees
- Avg. Hourly Wages - Tire Dealer Employees
- Avg. Temp. Deviation (1901-2000 Avg. = 0) [Regional]
- Avg. Temperature [Regional]
- Capacity Utilization – Vehicles & Parts (%)
- Construction Spending ($ Millions)
- Consumer Confidence (1985 = 100)
- Consumer Loans - Credit Cards & Revolving Plans ($B)
- New! Cooling Degree Days [Regional]
- Diesel Fuel ($ per Gallon)
- Diesel Fuel (1982 = 100) [Regional]
- Diesel Fuel Prime Supplier Sales (000s Gallons) [Regional]
- Disposable Income ($B)
- Durable Goods - Orders ($M)
- Durable Goods - Shipments ($M)
- Exch. Rates - Broad Composite (2006 = 100)
- Gasoline ($ per Gallon)
- Gasoline (1982 = 100) [Regional]
- Gasoline Prime Supplier Sales (000s Gallons) [Regional]
- HD Truck Sales (000s of Units)
- Housing Starts (000s Units) [Regional]
- Industrial Production - Motor Vehicles & Parts (2017 = 100) - Units
- Inflation Rate
- Interest Rates - Prime Rate
- Light Truck Sales (000s Units)
- Metals & Metal Products (1982 = 100) - Producer Prices
- Motor Vehicle Maintenance & Repair (1982-84=100) - Consumer Price
- Motor Vehicle Parts & Equipment (1982-84=100) - Consumer Price
- Motor Vehicle Parts (1982 = 100) - Producer Prices
- New Car Dealers Sales ($M)
- New Vehicles (1982-84=100) - Consumer Price [Regional]
- New! Nonrevolving Consumer Credit
- Passenger Car Sales (000s Units)
- Purchasing Managers Index
- New! Refinish Paints (2013 = 100) - PPI
- Tires & Repair Materials (1982 = 100) - Producer Prices
- Total Light Vehicle Sales (000s Units)
- Truck Tonnage (2015 = 100)
- New! Truck Transportation (2004 = 100) – PPI
- Unemployment Rate [Regional]
- Used Car Dealers Sales ($M)
- Used Vehicles (1982-84=100) - Consumer Price [Regional]
- VMT (Miles Driven) – U.S. DOT (Millions) [Regional]
- VMT (Miles Driven) – Arity (Millions) [Regional]
Features
Only the data you need and nothing more
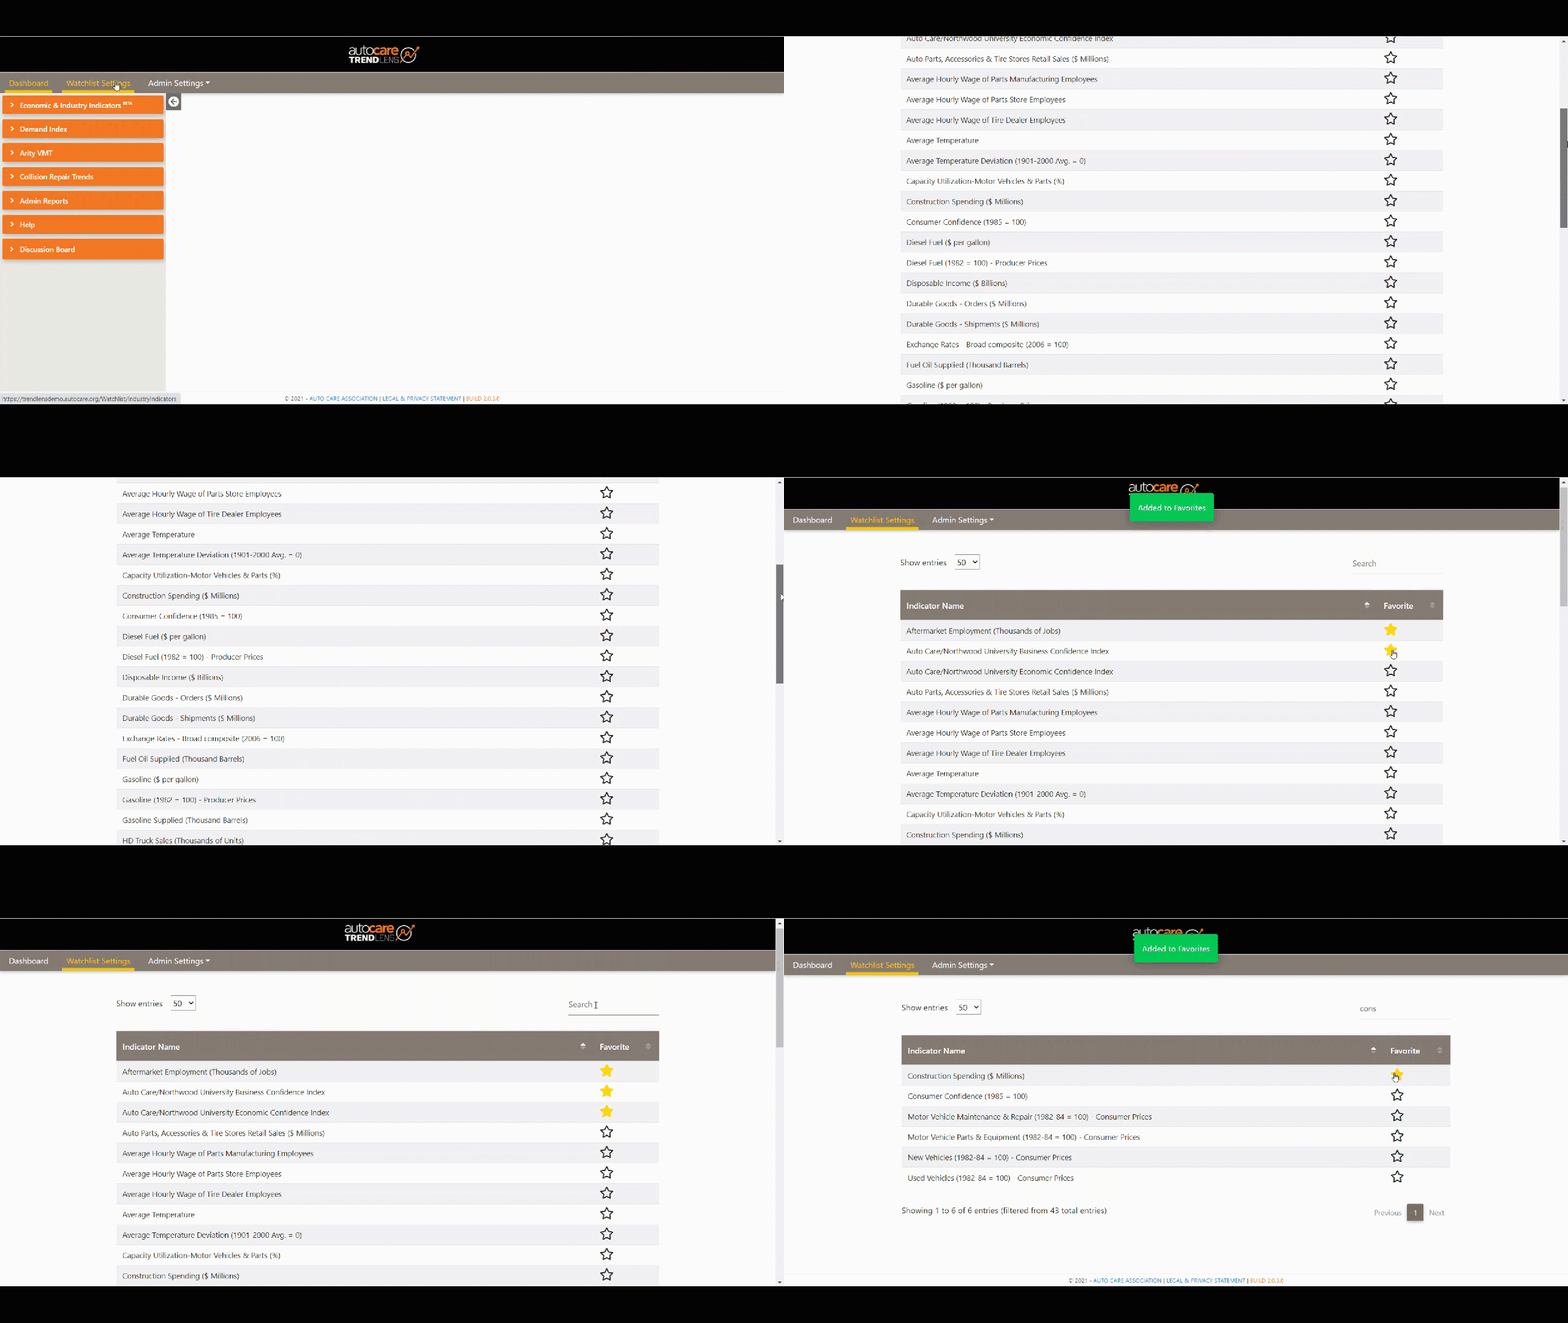
Sign up for alerts to see when your data is updated
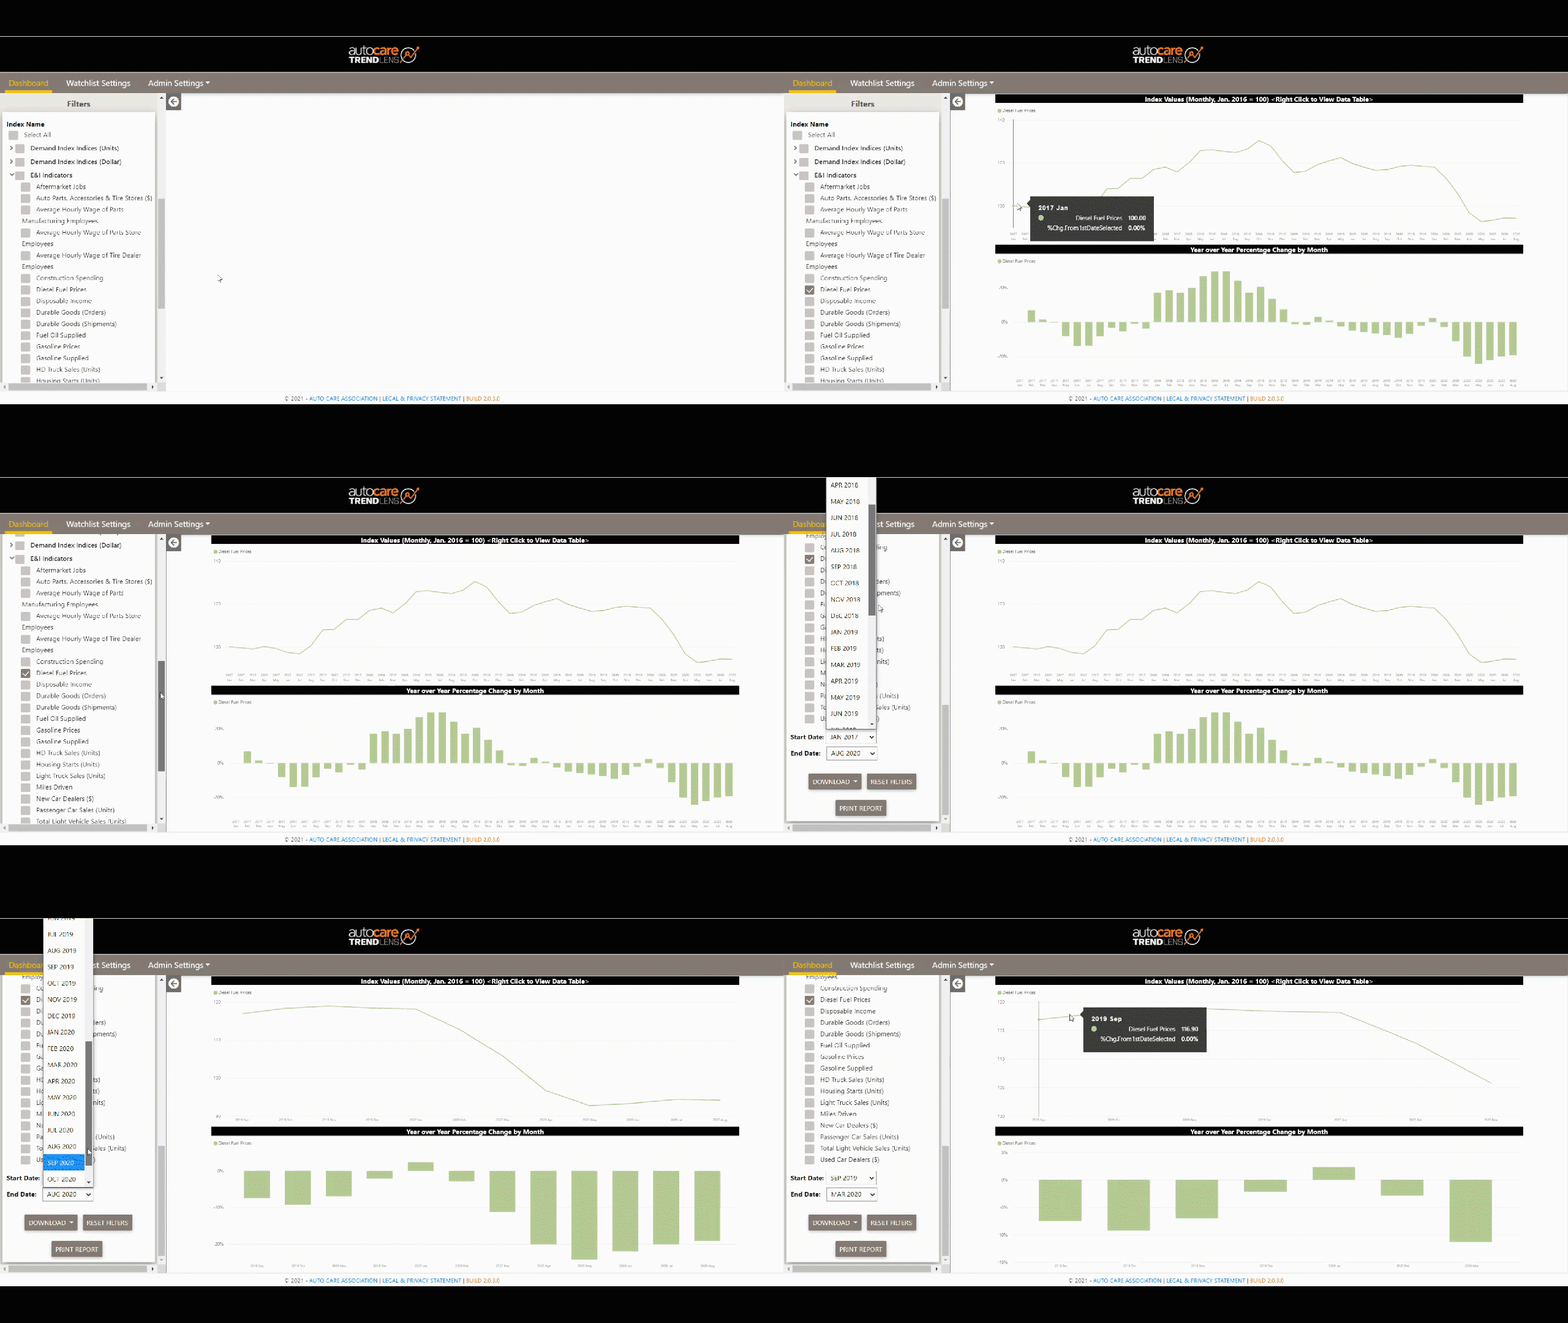
Engage with the data to identify which datasets are most important to you
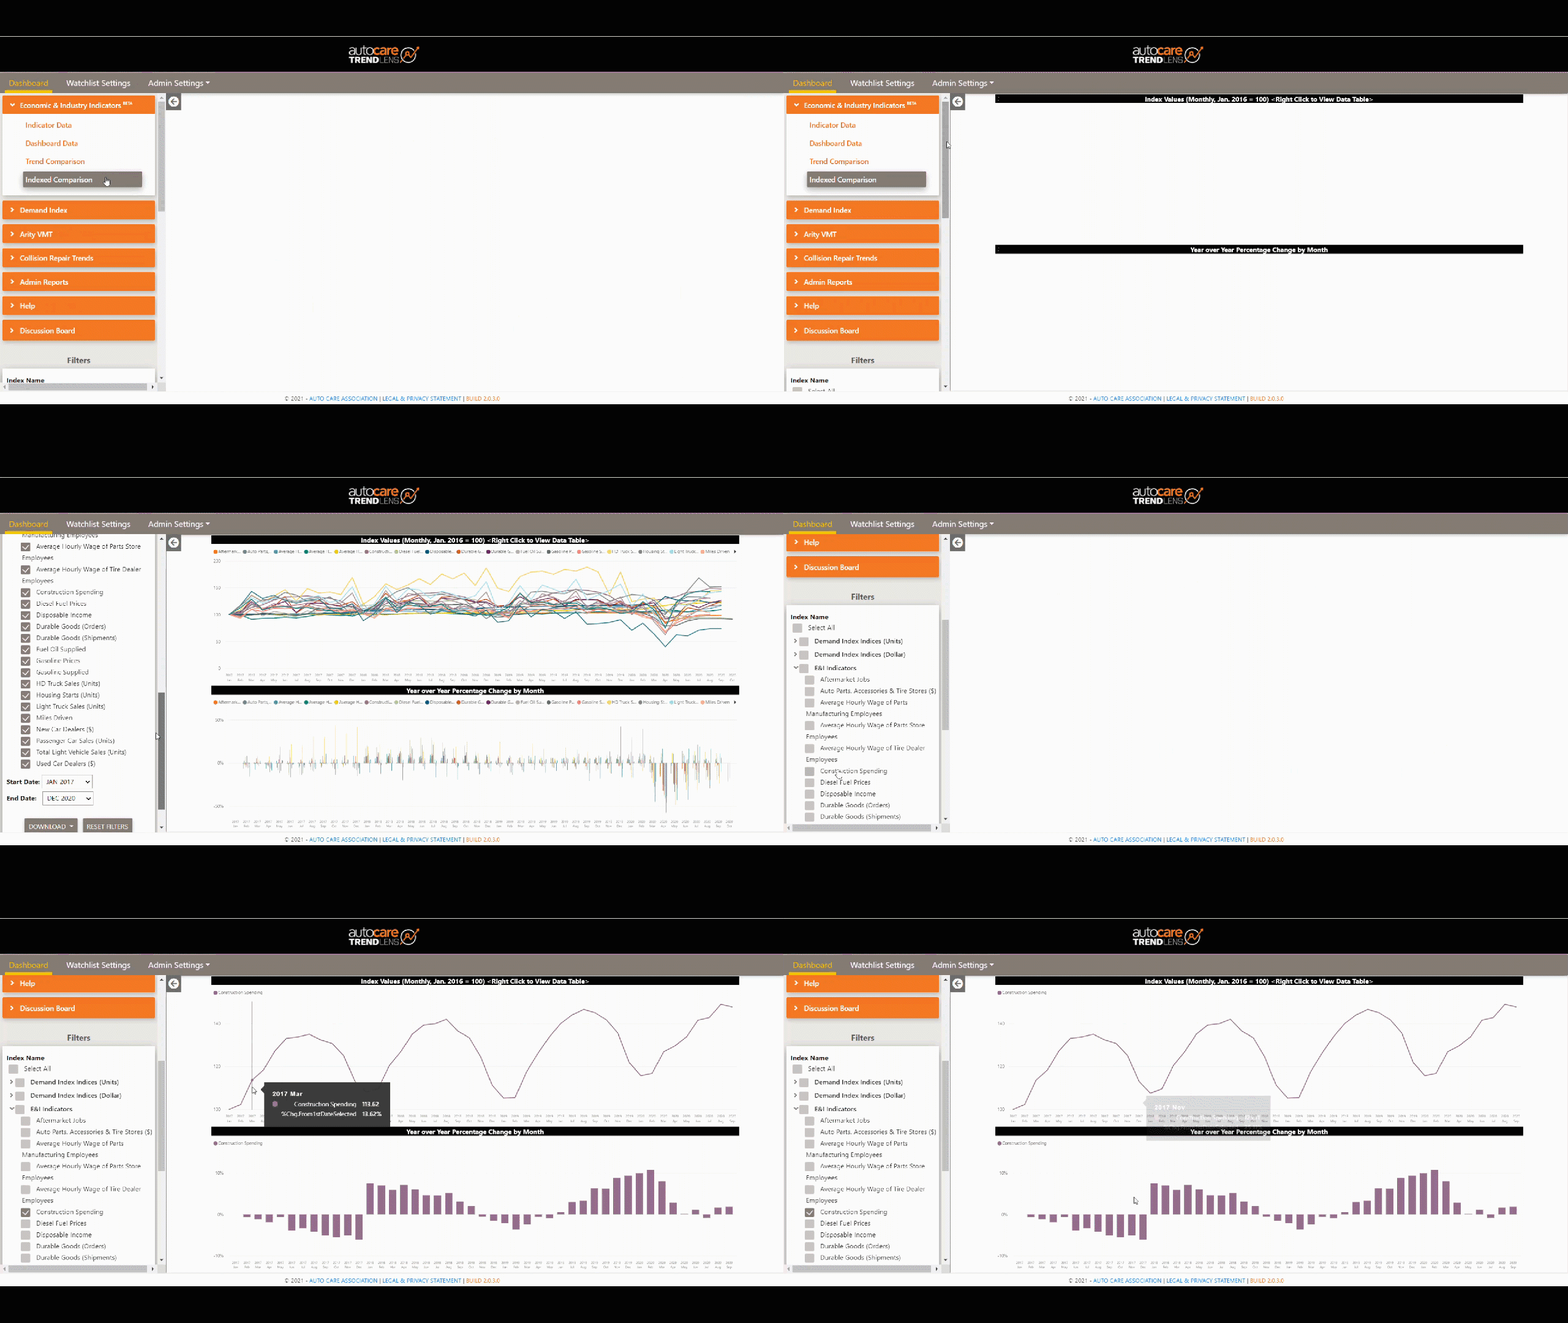
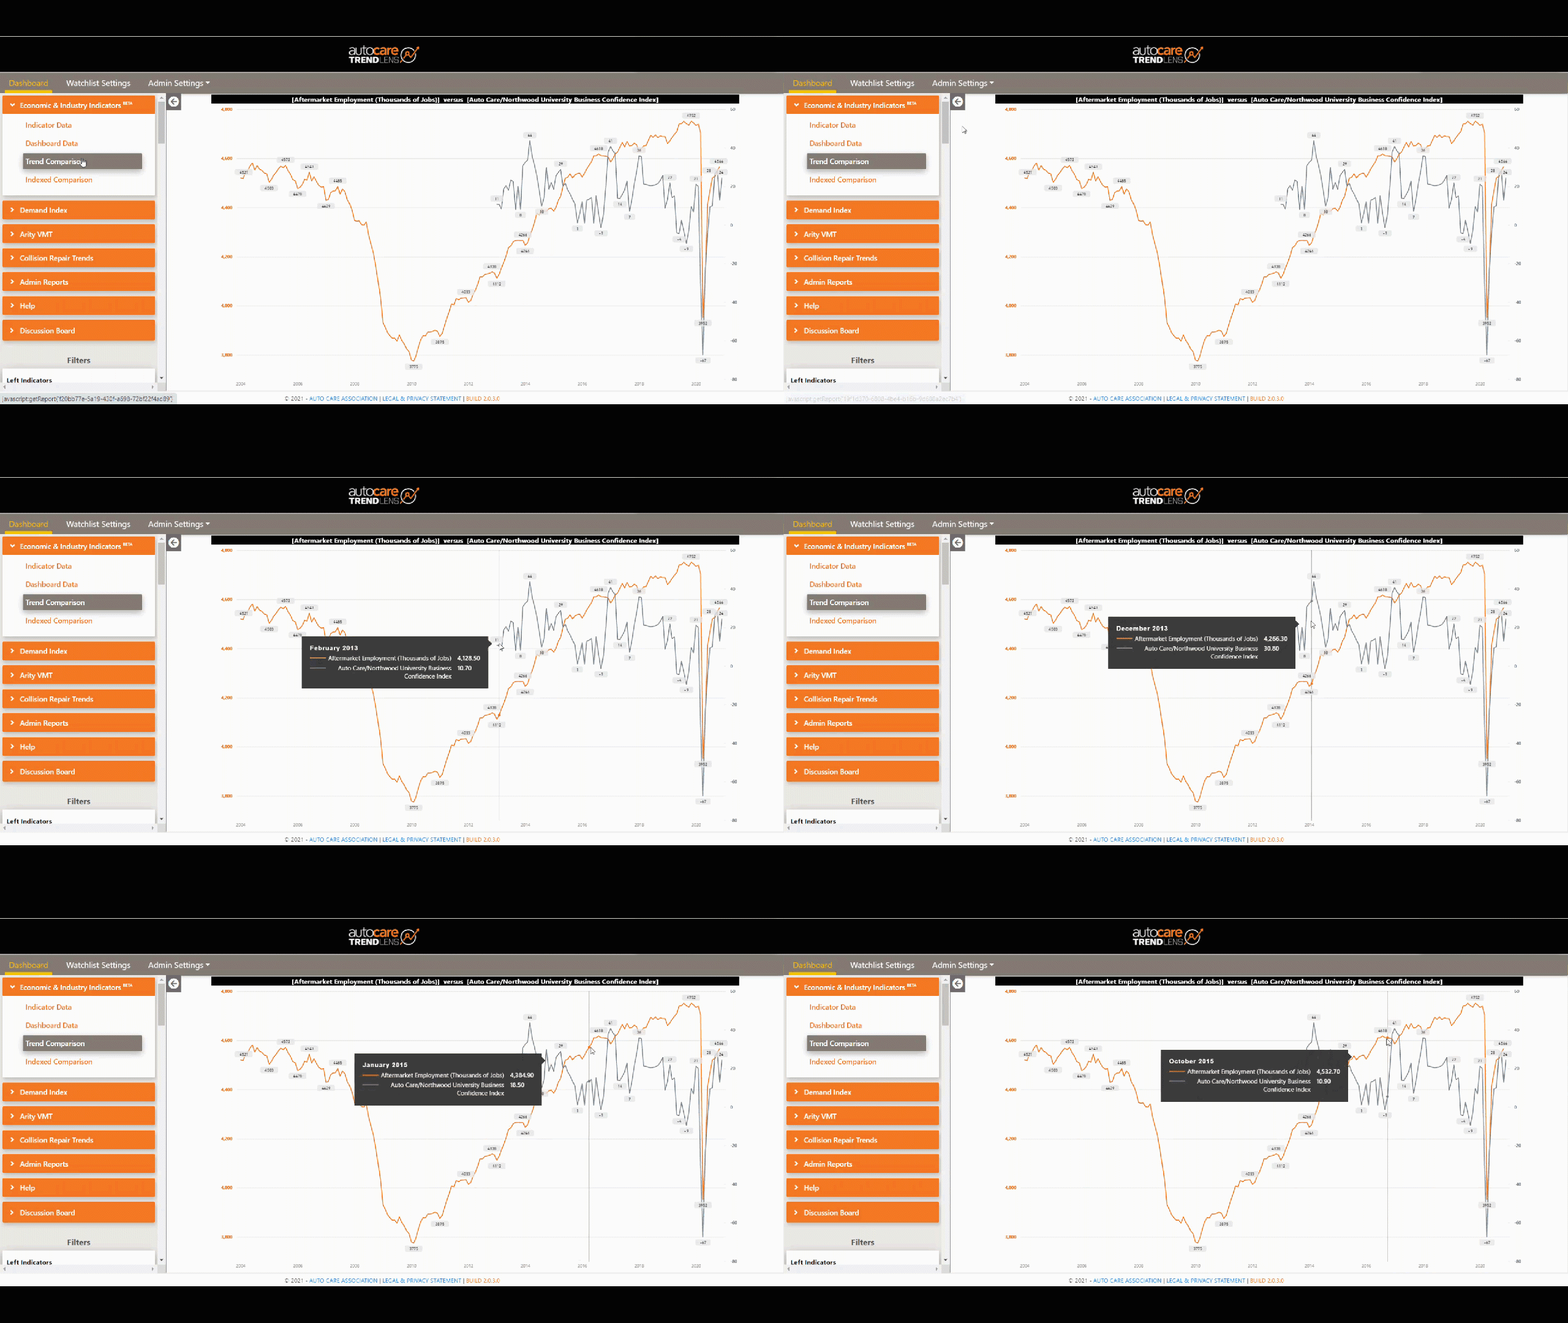
Comparing Economic and Industry Indicators: A lot of the power of data comes from the ability to compare and contrast datasets with one another. Looking at one dataset can give you a 2D look; looking at a dataset in relation to others gives you a 3D view. That's why the TrendLens™ team has made sure that all your TrendLens™ data can be cross-examined. You can use TrendLens™ Economic and Industry Indicators section like an insight sandbox to compare any dataset available to you.
How Can I Use TrendLens
With TrendLens, know what external market factors may be impacting your product groups. Tools like Economic Indicators and Collision Repair Trends make it easier to get a clearer picture of the economic business world surrounding your product. TrendLens Demand Index even lets you see how your products are performing versus the market nationally AND regionally.
TrendLens helps you understand the impact your marketing strategies are having on your products. Weed out factors that are impacting the industry as a whole, so you can confidently see the influence your marketing work is having. TrendLens' Demand Index even lets you see how your marketing efforts are impacting your product performance versus the market nationally AND regionally.
The world around your business is always changing. TrendLens can help you prepare for shifts in the industry with datasets like Economic Indicators and reports like Collision Repair Trends. TrendLens' Demand Index lets you see how your products are performing versus the market nationally AND regionally. When you're planning next year's overall business strategy, turn to TrendLens for industry insights.
Regional Demand Index and Economic and Industry Data
Arizona
California
Colorado
Idaho
Montana
Nevada
New Mexico
Oregon
Utah
Washington
Wyoming
Illinois
Indiana
Iowa
Kansas
Michigan
Minnesota
Missouri
Nebraska
North Dakota
Ohio
South Dakota
Wisconsin
Alabama
Arkansas
Delaware
District of Columbia
Florida
Georgia
Kentucky
Louisiana
Maryland
Mississippi
North Carolina
Oklahoma
South Carolina
Tennessee
Texas
Virginia
West Virginia
Connecticut
Maine
Massachusetts
New Hampshire
New Jersey
New York
Pennsylvania
Rhode Island
Vermont
California
Oregon
Washington
Arizona
Colorado
Idaho
Montana
Nevada
New Mexico
Utah
Wyoming
Iowa
Kansas
Minnesota
Missouri
Nebraska
North Dakota
South Dakota
Illinois
Indiana
Michigan
Ohio
Wisconsin
New Jersey
New York
Pennsylvania
Connecticut
Maine
Massachusetts
New Hampshire
Rhode Island
Vermont
Arkansas
Louisiana
Oklahoma
Texas
Alabama
Kentucky
Mississippi
Tennessee
Delaware
District of Columbia
Florida
Georgia
Maryland
North Carolina
South Carolina
Virginia
West Virginia
NEW! Regional Economic and Industry Data (over 10+ key data sets including Arity VMT).
What's ahead
COMING SOON! Other premium datasets from respected industry partners to put into focus the markets surrounding your business.
What users are saying
I've been using this data to explain the recent surge in DIY channel share. Your system makes it easy to plot and compare metrics.
Robert Pietrowsky, Director, Category Management, DRIVWe use TrendLens to look for trends to understand business results and correlate to future outcomes. The data is all in one location – it is housed in an easy-to-use format so I can pick the specific data that we want to use. This helps with explaining business results and forecasts to our C-suite.
Thomas Tecklenburg, VP, North America Aftermarket, Dayco
As a shop owner, TrendLens is one of the few available tools specific to our industry that gathers industry data in one place. Without it, we would have to pay large amounts of money and try to decipher other platforms. We’ve used TrendLens data when writing a business plan to execute funding for a new building.
Tara Topel, Co-Owner, Topel’s Service Center
I use TrendLens to check industry trends and get up-to-date data. It is more current than other platforms and is specific to the aftermarket industry.
Larry Pavey, CEO, Automotive Parts Services GroupTrendLens helps me and my team monitor specific industry data points – it is easy to use and rich with data. The ease of comparing data trends in TrendLens is particularly useful.
Kevin Rozsa, EVP Business Development, Transtar Industries LLC
TrendLens helps us monitor specific data points relevant to specific manufacturers we as a company represent. As a single source for multiple points of data, it helps us provide market intelligence to our manufacturer partners.
Gideon Norris, Director of Category Management, NA WilliamsTrendLens and Demand Index help me monitor key economic drivers – it’s a one-stop location for many key economic drivers including VMT and point-of-sale data. The data has helped our team rebalance budgets based on seasonality.
T.J. Fontana, Director of Sales, Dayco ProductsIt’s nice to have both general economic indicators, like housing starts, and automotive indicators, all together in one place. This data gives a sense of direction where our business may be headed.
Dave Farrell, Sales and Pricing Analyst, Transtar Industries LLC
Find More Events:
join an office hours session
TrendLens users can sign up to attend a live "office hours" session with Mike Chung, Director, Market Intelligence.
Explore the data, views and reports available and come with the questions surfacing in your organization and discuss the data you are looking at in a small group setting.
See how your exclusive membership access to TrendLens can help you make better business decisions!
Fill out the form and one of our experts will get in touch with you.
TrendLens Member
Free for members
Economic and Industry data sets and views
- Economic and Industry Indicators Data
- Monthly Vehicle Miles Travelled from Arity
- Dashboard View
- Trend Comparison
- Indexed Comparison
- Weekly Vehicle Miles Travelled from Arity
- Regional Economic and Industry Data
(10+ key data sets including Arity VMT)
TrendLens Added Features
- Filter by date
- Show as a table
- Watchlist alerts
- Export Data
- Print Reports
TrendLens Non-member
Available soon
Economic and Industry data sets and views
- Economic and Industry Indicators Data
- Monthly Vehicle Miles Travelled from Arity
- Dashboard View
- Trend Comparison
- Indexed Comparison
- Weekly Vehicle Miles Travelled from Arity
- Regional Economic and Industry Data
(10+ key data sets including Arity VMT)
TrendLens Added Features
- Filter by date
- Show as a table
- Watchlist alerts
- Export Data
- Print Reports
Cost:
COMING SOON!
Click here for Demand Index Product Pricing.
