Navigate the Economic Snow Globe with Weekly Vehicle Miles Traveled Data
Welcome to the month of March! Like most years, it’s that time of year when the weather plays with us – is winter ending? Unlike most years, though, numerous uncertainties persist. I’ve talked about the cloudy nature of the crystal ball when considering aftermarket activities, and it hit me the other day.
It’s not a crystal ball – it’s a snow globe.

Crystal ball from Forbes; snow globe from MTL Magazine
So many variables are “up in the air.” Then, once you think things are settling into a predictable rhythm ... whoosh ... someone has shaken it up and everything’s all over the place again.
As I write this, my son’s school district has begun its return to in-person learning (hybrid model - two days/week) after nearly one full year of remote learning. Like others, schools have been tracking a variety of data: new cases per capita, positive COVID-19 test results, schools’ ability to mitigate risk, hospital occupancy and more (e.g., Arlington County Public Schools; State of Virginia).
As students re-enter the classroom, schools, teachers, students, parents and staff will all adapt and adjust as best as they can and as the situation requires … much like the aftermarket has responded to the changing market and societal conditions this past year.
Weekly Arity Miles Traveled
We recently announced the availability of Vehicle Miles Traveled (VMT) data from Arity on a monthly basis (read more here). We are now even more excited to share Arity Vehicle Miles Traveled data on a weekly basis.
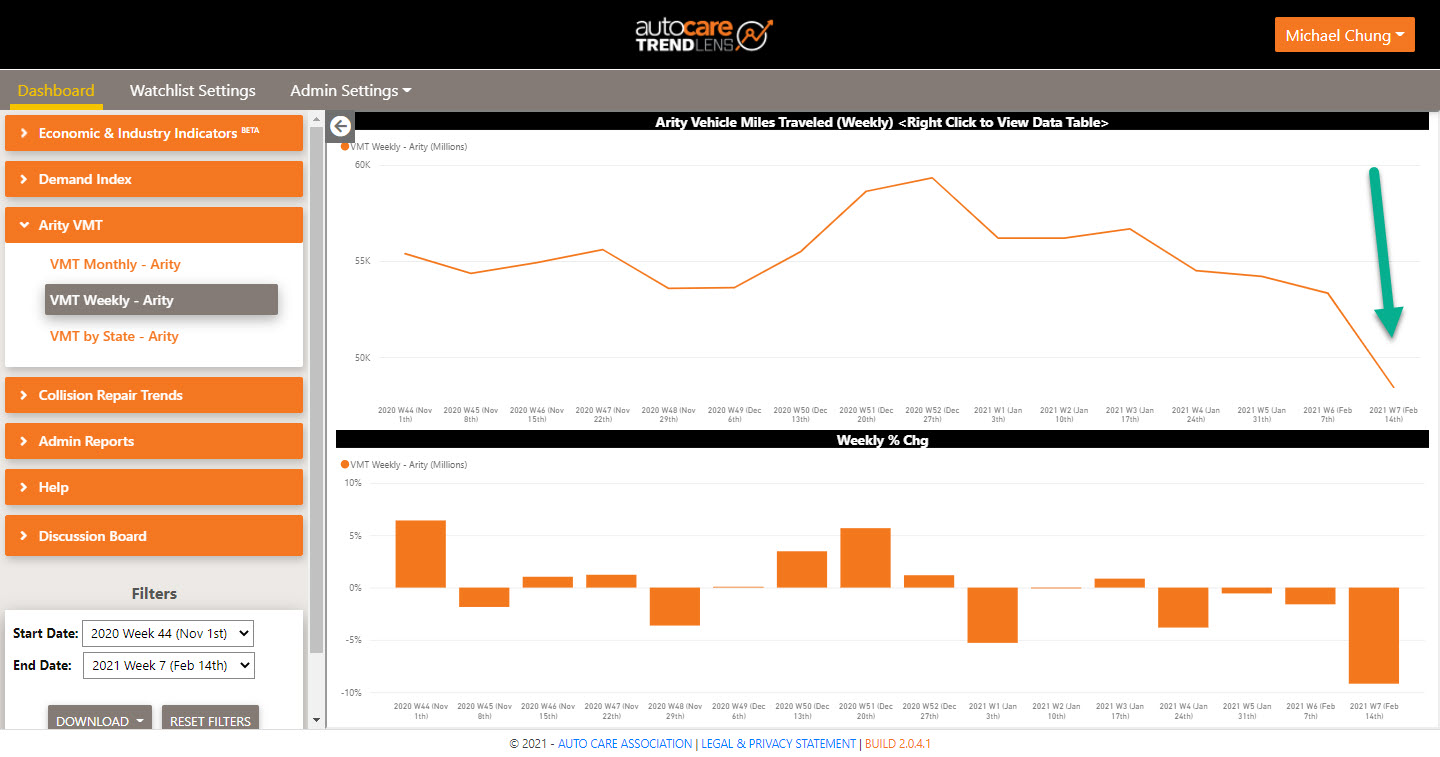
Since VMT has been a leading indicator of aftermarket activity, we are confident that the availability of more recent data will be even more valuable for anticipating aftermarket activity and demand. Just a few weeks ago, the extreme weather in southern states like Texas put life on hold for many. The chart below reflects this reality: national VMT the week of Feb. 14 was 9% lower than the prior week.

Arity Weekly Mileage Data, from Week 44, 2020 (Nov. 1) through Week 7, 2021 (Feb. 14)
As of Feb. 15, 2021, Arity VMT is accessible on a weekly basis to all Auto Care Association members at no charge during the “Market View” 60-day trial period. Members may access it via our TrendLens platform.
Arity is a wholly owned subsidiary of The Allstate Corporation. Mileage is calculated based on data collected from 23 million active connections from multiple third-party anonymized and aggregated sources, including consumer apps, insurance telematics mobile and device programs.
Stimulus and Post-Pandemic Activity Impacts on Automotive Aftermarket
At the time of this writing, the $1.9 trillion stimulus proposal has passed the House of Representatives and is on its way to the Senate. One part of the coronavirus relief bill is a $1,400 check to individuals with household incomes less than $75,000 (Washington Post).
As the vaccine rollout continues, we all look forward to resumption of activities: travel, socializing, in-person work and school, entertainment and so on. Another question being asked is whether the post-COVID world will see a surge in driving and activities?
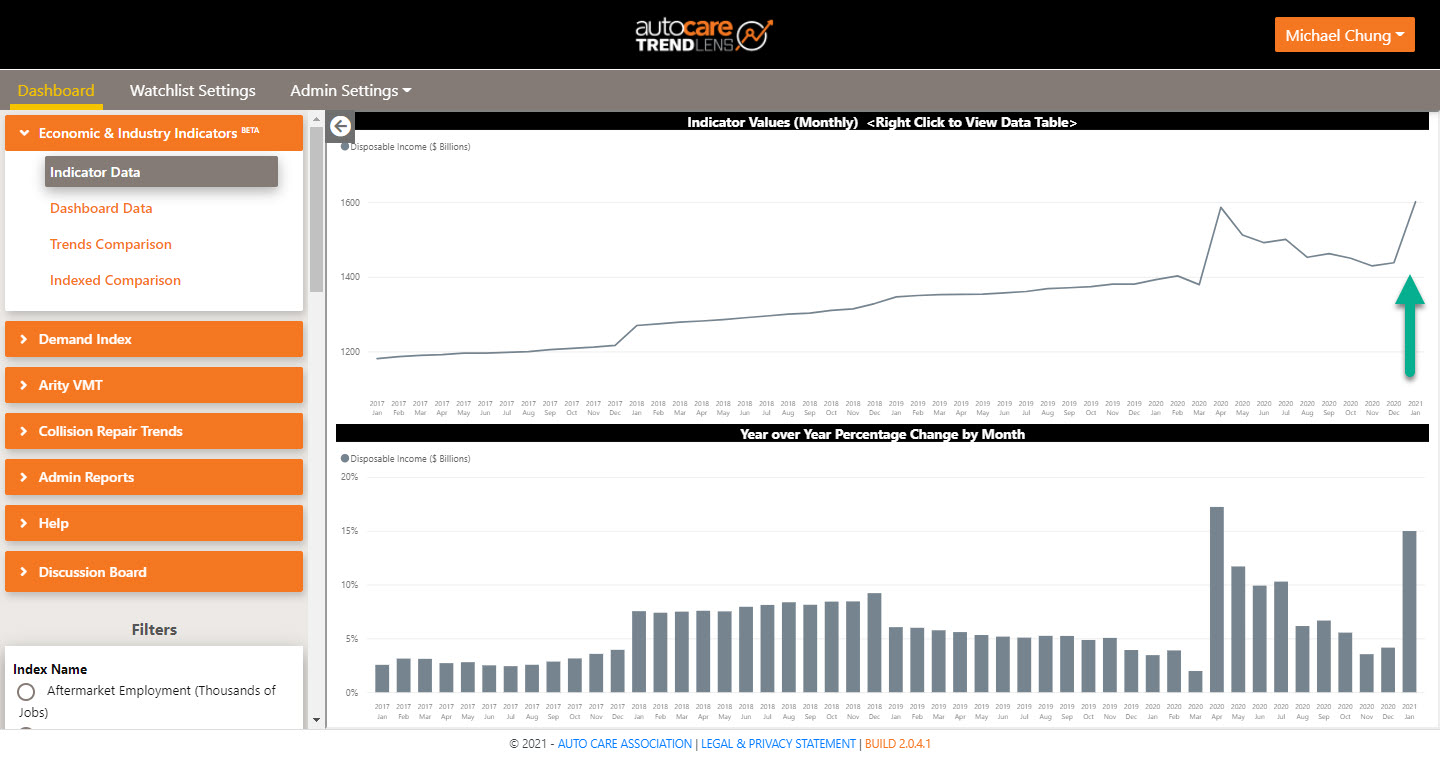
The Cares 2.0 Act contributed to the rise of U.S. disposable income to a record high of $1.6 trillion in January, an 11% increase from December. The chart below shows disposable income from January 2004 to December 2020:

Source: TrendLens™
The green arrow indicates the significant jump in disposal income from December 2020 to January 2021.
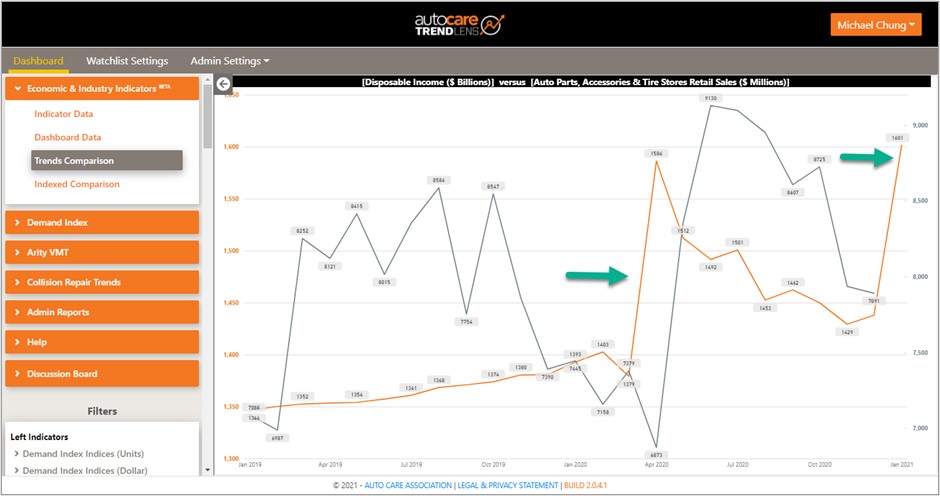
Will the extra “cash on hand” lead to increased retail aftermarket revenue? History suggests “yes.” The chart below shows historical disposable income in orange and auto parts, accessories and tire stores retail sales in gray from January 2019 to January 2021:

Source: TrendLens™
The first green arrow points to an increase in disposable income from March to April 2020. One month later, aftermarket retail sales shot up. The second green arrow is the increase in disposable income from December 2020 to January 2021. While January 2021 aftermarket retail sales are not yet available, tune in to TrendLens™ to keep an eye on February 2021 aftermarket retail sales
(Click here to access a video on how to add this variable to your Watchlist to receive an email notification when this variable is updated: go to “The Basics”, then “Helpful Resources” or “Demand Index”, then “Economic Indicators Correlations”.)
Consumers appear to be chomping at the bit to travel in the post-pandemic world. Based on a recent survey of U.S. consumers, Martec found that on average, U.S. adults expect to drive 17% more post-pandemic overall (*) – a little more for household (21%) than for business purposes (11%). Perhaps you feel the same way. “After this is all over, I’m going to take my family for a vacation,” … “When it’s safe again, I’ll hit the road to visit my clients and prospects.”
(*) Where ‘post-pandemic’ is described as when the vaccine is widely distributed.
To be sure, it’s a mix of variables:
-- A sizeable portion of the population has moved due to the pandemic – 8% according to Martec. White collar employees may drive to the office less frequently but may have a longer commute.
-- People who expect to drive more may change their mind.
That said, certain segments of the population do expect to drive more based on Martec’s study: Dads who are DIYers and younger women who tend to work full-time and live in suburban/rural America.
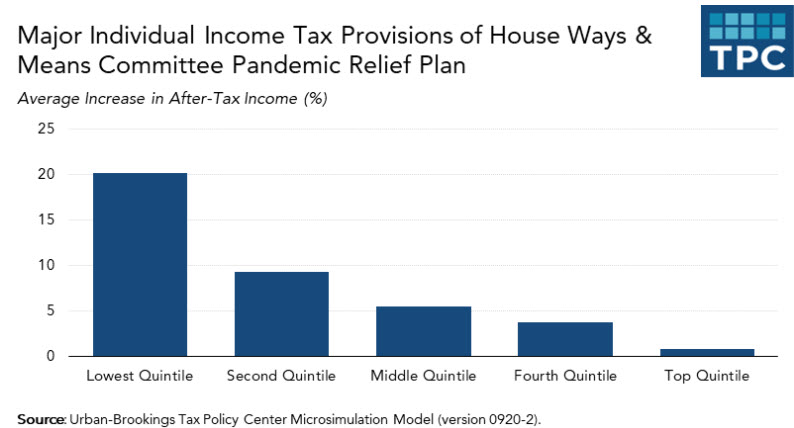
Back to pandemic relief and impact on household income: the proposed pandemic relief bill is projected to reduce 2021 Federal taxes by an average of $3,100, with two-thirds of benefits going to households with less than $91,000 in annual income, and 11% of benefits going to households earning $164,000 or more each year (Urban-Brookings Tax Policy Center).
This is potentially significant since the increase in after-tax income may be substantial:

Source: Urban-Brookings Tax Policy Center
The infusion of cash will likely encourage some consumers to take care of necessary repairs and others to purchase accessories and performance-related products.
Time will tell – we’ll see how the numbers play out across the aftermarket and across the broader economy. And if the snow globe gets another shake, we’ll be prepared.

Michael Chung, Director, Market Intelligence
Ready to dive into market research? I provide the industry with timely information on key factors and trends influencing the health of the automotive aftermarket and serving as a critical resource by helping businesses throughout the supply chain to make better business decisions. More About Me

Market Insights with Mike is a series presented by the Auto Care Association's Director of Market Intelligence, Mike Chung, that is dedicated to analyzing market-influencing trends as they happen and their potential effects on your business and the auto care industry.
More posts
Content
-
[WATCH] Driver Behavior Trends and Their Impact on Parts and Service Opportunities
March 17, 2022This webinar analyzes driving behavior at the national, state, and local levels. Gain insights into: consumer behavior; driving patterns; and potential impacts on parts replacement, service and repair scheduling, vehicle age, and the car parc.
-
[WATCH] 2022 Business Outlook: Top Emerging Opportunities and Challenges
February 4, 2022This webinar explores need-to-know emerging opportunities and challenges for the coming year: current status of supply chain issues and what to expect in the year ahead and more.
-
[WATCH] How to Use Vehicle Miles Traveled to Better Your Bottom Line in 2022
December 3, 2021Vehicle Miles Traveled has been respected for years as a key indicator of aftermarket opportunities. Historically, planning has been limited to directional indicators but now aftermarket businesses can leverage more detailed insights on geographic differences as well as vehicle differences to more effectively take advantage of aftermarket opportunities.
