July 22, 2021
Use Weekly VMT to Predict Retail Impact
by Michael Chung, Director, Market Intelligence
Throughout the spring and summer the country has hit the “reset” button for activity and travel. Nearly half of the nation is fully vaccinated (48.8% as of July 21, The Washington Post) and since March, leisure travel has resumed.
Since vehicle miles traveled (VMT) is a leading indicator of aftermarket activity, did Americans take road trips during Independence Day weekend? The America Automobile Association predicted that nearly 44 million Americans would gravel by automobile for the holiday, 5.1% more than in 2019, and 34.1% more than in 2020 (AAA, June 22, 2021)

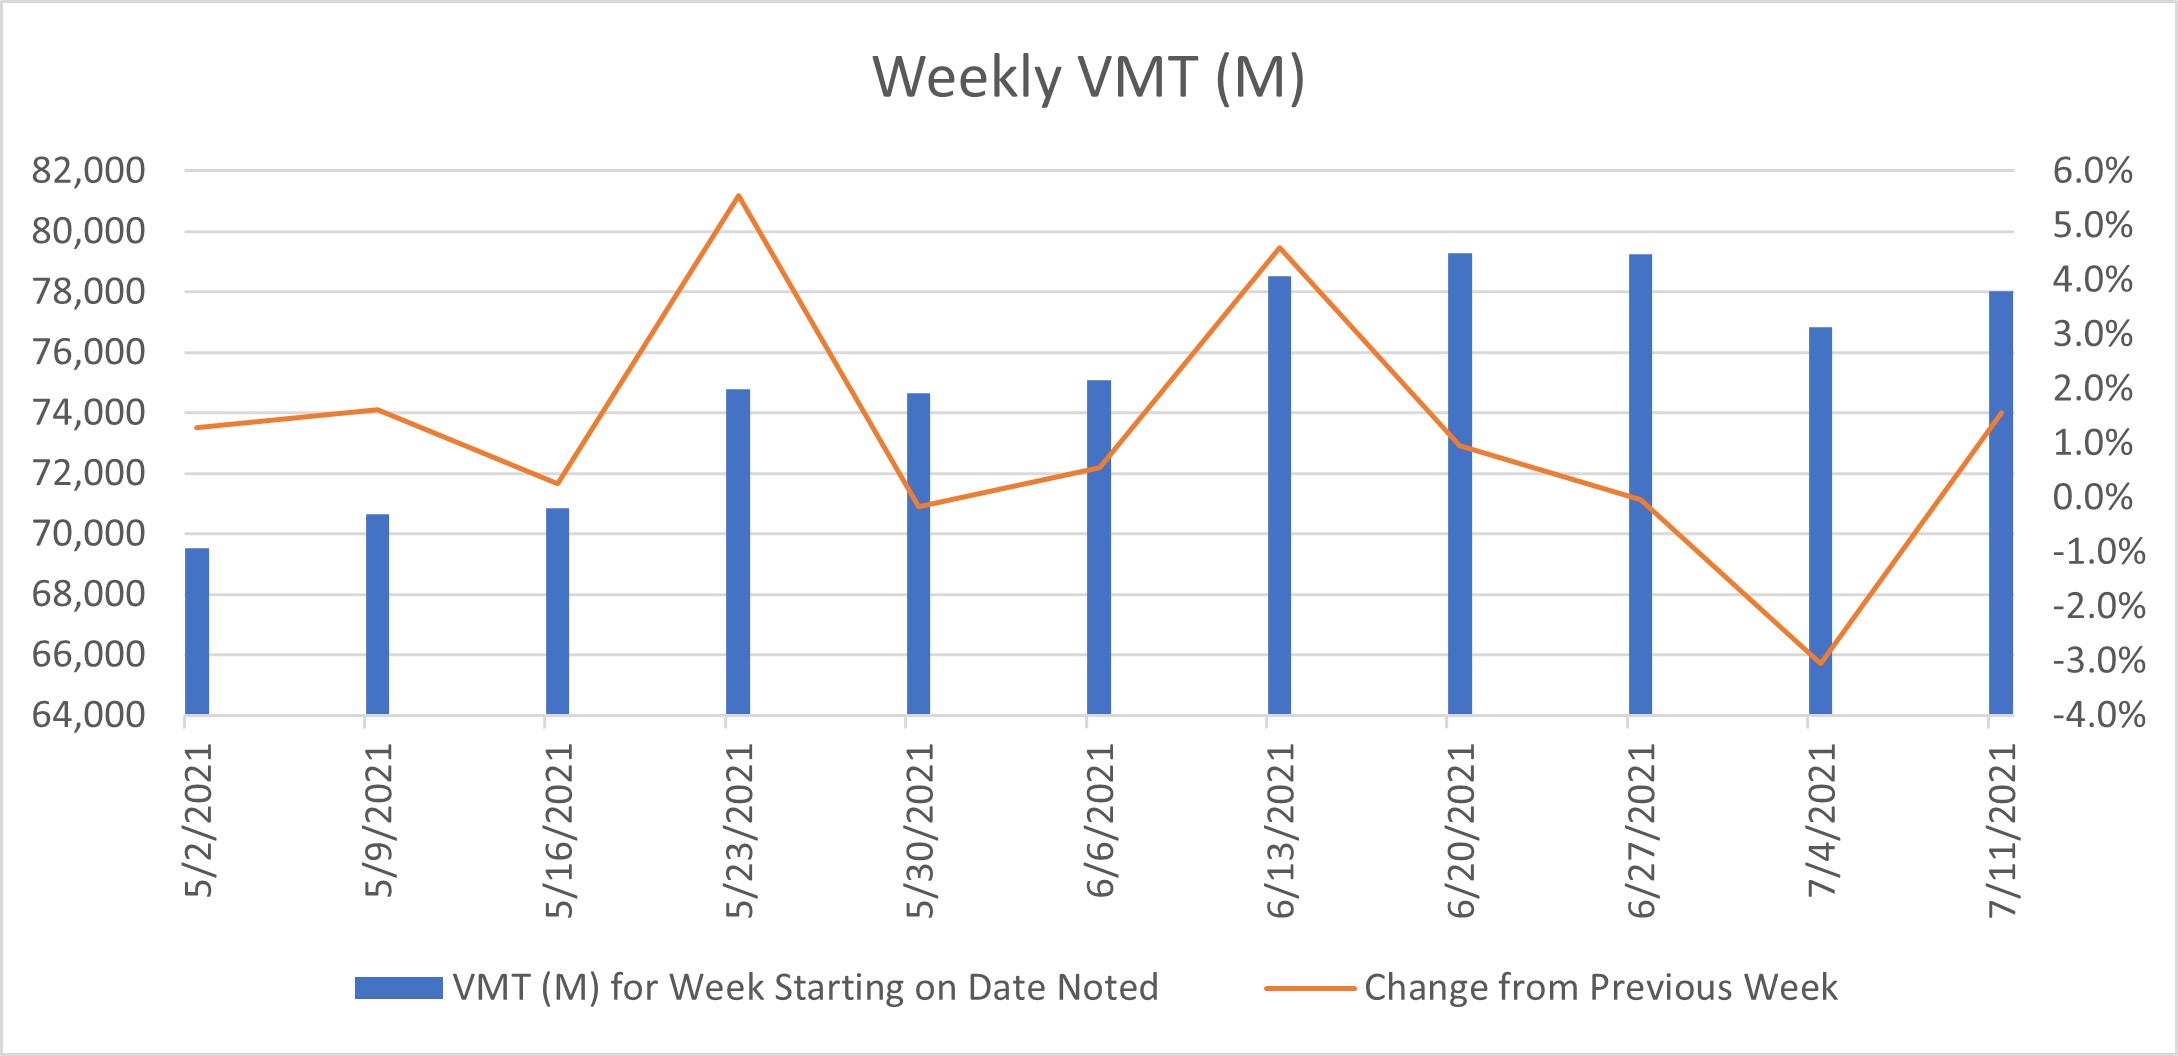
This confirms that not only was there pent-up demand to travel, but that travel for July 4 weekend via automobile in 2021 exceeded the past two years. Just as interesting, VMT for the weeks of June 27 and July 4, 2021 were comparable to previous weeks, illustrated below.

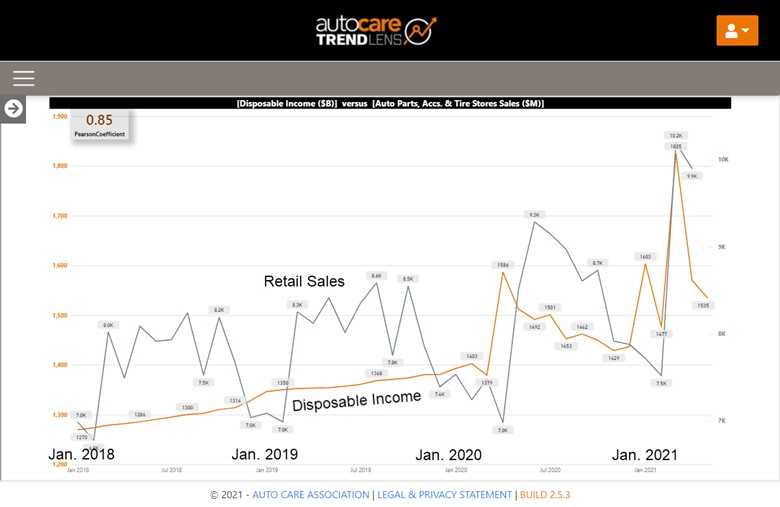
The next figure illustrates disposable income (orange) against retail sales of automotive parts, accessories, and tire stores (gray) from January 2018 through June 2021. These indicators are more strongly correlated, with a Pearson correlation coefficient of 0.85.

All Auto Care Association members have exclusive access to Economic and Industry Indicators data, as well as Arity Monthly VMT in TrendLensTM. To upgrade your account to include Arity Weekly VMT and to export data from TrendLensTM, click here to subscribe to the Market View package – at $100/month, we are confident that this modest investment will more than pay for itself in honing your marketing strategies and promotions.
Arity is a wholly owned subsidiary of The Allstate Corporation. Mileage is calculated based on data collected from 23 million active connections from multiple third-party anonymized and aggregated sources, including consumer apps, insurance telematics mobile and device programs
Since vehicle miles traveled (VMT) is a leading indicator of aftermarket activity, did Americans take road trips during Independence Day weekend? The America Automobile Association predicted that nearly 44 million Americans would gravel by automobile for the holiday, 5.1% more than in 2019, and 34.1% more than in 2020 (AAA, June 22, 2021)
What actually happened?
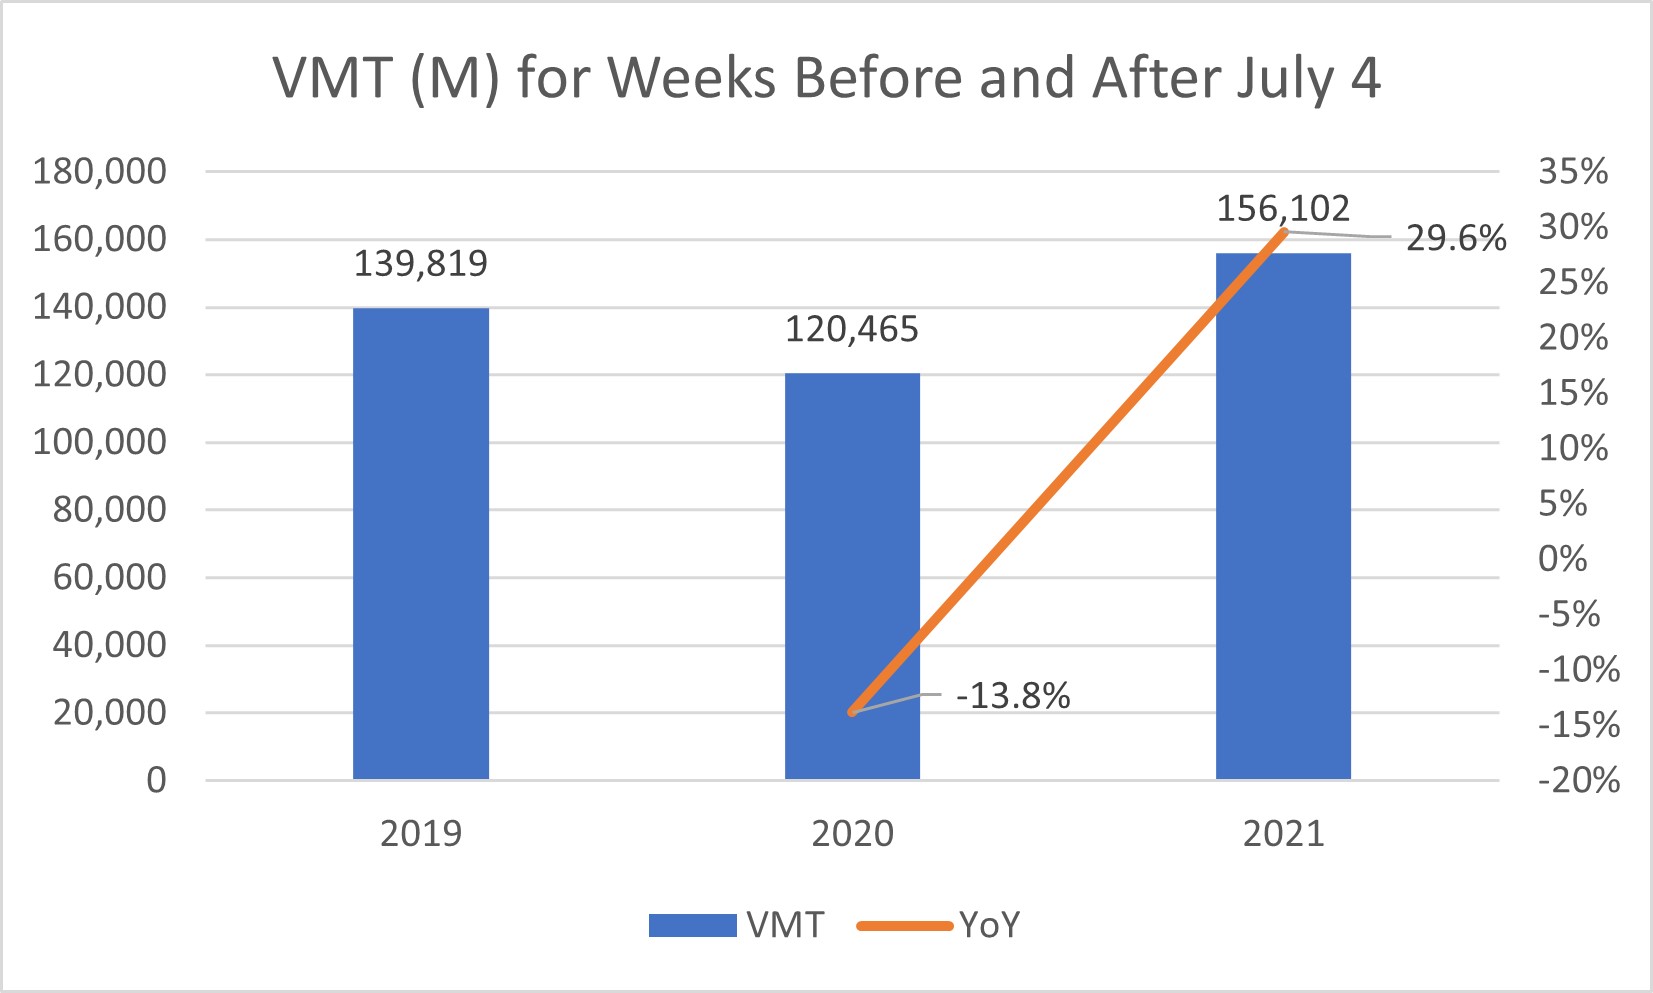
Relative to previous years, VMT for the two-week period around July 4, 2021 was higher than for the same time period in 2019 and 2020.
Source: Arity
This confirms that not only was there pent-up demand to travel, but that travel for July 4 weekend via automobile in 2021 exceeded the past two years. Just as interesting, VMT for the weeks of June 27 and July 4, 2021 were comparable to previous weeks, illustrated below.

Source: Arity
So, what?
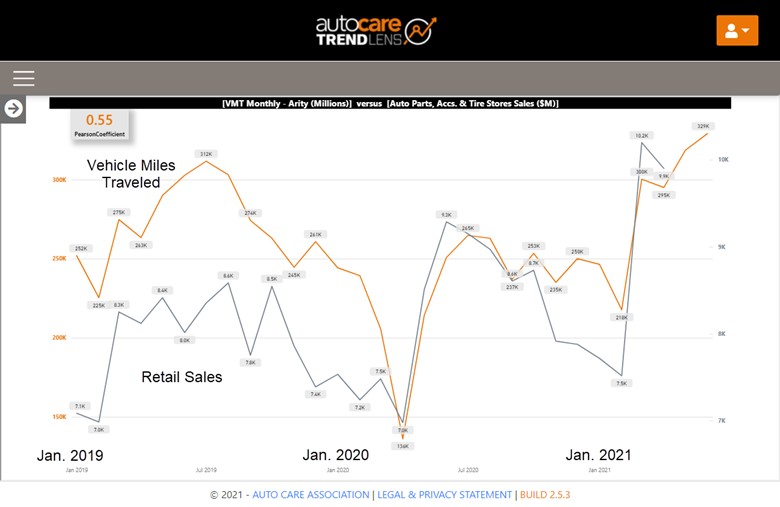
Intuitively, we know that VMT correlates with vehicle maintenance and related sales … but by how much? Auto Care Association members can use TrendLensTM to compare two industry indicators and can instantly see the level of correlation. In the chart below, monthly VMT (vehicle miles traveled, orange) is plotted against retail sales for automotive parts, accessories, and tire stores (gray) from January 2019 through June 2021. These indicators are moderately correlated: the Pearson correlation coefficient for these two variables is 0.55 (displayed in the upper left, a new TrendLensTM feature), denoting a moderate positive correlation – this means that they generally rise and fall together.Source: TrendLensTM
The next figure illustrates disposable income (orange) against retail sales of automotive parts, accessories, and tire stores (gray) from January 2018 through June 2021. These indicators are more strongly correlated, with a Pearson correlation coefficient of 0.85.

Source: TrendLensTM
What’s in it for me?
Tracking variables that you know to be leading indicators for industry activity (demand for parts and service) can give you time to anticipate consumer behavior and stock products / staff resources accordingly.All Auto Care Association members have exclusive access to Economic and Industry Indicators data, as well as Arity Monthly VMT in TrendLensTM. To upgrade your account to include Arity Weekly VMT and to export data from TrendLensTM, click here to subscribe to the Market View package – at $100/month, we are confident that this modest investment will more than pay for itself in honing your marketing strategies and promotions.
Arity is a wholly owned subsidiary of The Allstate Corporation. Mileage is calculated based on data collected from 23 million active connections from multiple third-party anonymized and aggregated sources, including consumer apps, insurance telematics mobile and device programs

Michael Chung, Director, Market Intelligence
Ready to dive into market research? I provide the industry with timely information on key factors and trends influencing the health of the automotive aftermarket and serving as a critical resource by helping businesses throughout the supply chain to make better business decisions. More About Me

Market Insights with Mike is a series presented by the Auto Care Association's Director of Market Intelligence, Mike Chung, that is dedicated to analyzing market-influencing trends as they happen and their potential effects on your business and the auto care industry.
More posts
Latest related
Content
-
[WATCH] Driver Behavior Trends and Their Impact on Parts and Service Opportunities
March 17, 2022This webinar analyzes driving behavior at the national, state, and local levels. Gain insights into: consumer behavior; driving patterns; and potential impacts on parts replacement, service and repair scheduling, vehicle age, and the car parc.
-
[WATCH] 2022 Business Outlook: Top Emerging Opportunities and Challenges
February 4, 2022This webinar explores need-to-know emerging opportunities and challenges for the coming year: current status of supply chain issues and what to expect in the year ahead and more.
-
[WATCH] How to Use Vehicle Miles Traveled to Better Your Bottom Line in 2022
December 3, 2021Vehicle Miles Traveled has been respected for years as a key indicator of aftermarket opportunities. Historically, planning has been limited to directional indicators but now aftermarket businesses can leverage more detailed insights on geographic differences as well as vehicle differences to more effectively take advantage of aftermarket opportunities.
Visit

