Recent Trends in Vehicle Miles Driven During COVID-19
With millions of Americans working from
home due to office and school closures, many in the industry are wondering
about vehicle miles travelled (VMT) statistics – and rightly so! VMT
statistics are correlated with the health of the aftermarket industry, and
this makes intuitive sense – the more miles driven, the more that maintenance,
repair, and replacement of vehicles will be required.
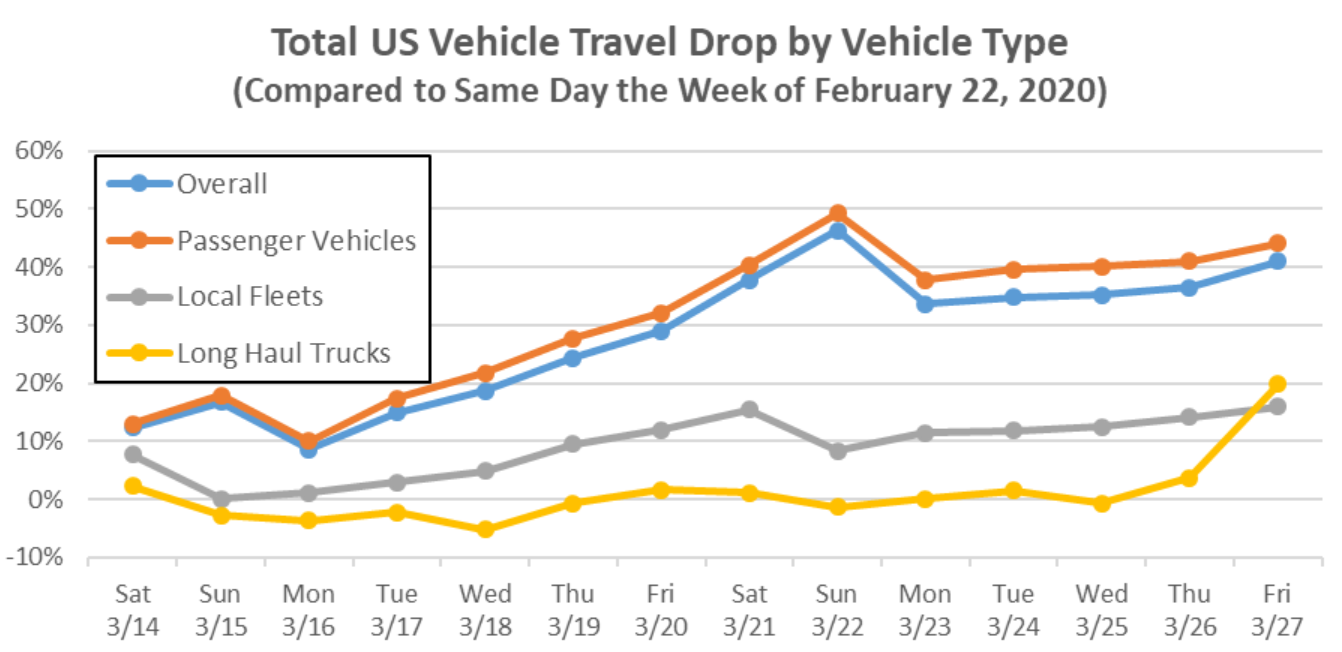
But what about the past few weeks, since COVID-19 has whipsawed the economy? In my local neighborhood, there is certainly less traffic, but what about the entire nation? Transportation data provider INRIX reports that overall daily national traffic volume for consumers, local fleets, and long-haul trucks was down 38% for March 21-27, relative to Feb. 22-28.
Based on anonymous speed/location data reported in real-time from all road types for more than 100 million trips per day in the United States, INRIX found that relative to typical daily travel (Friday 2/22):
-
Nationally, personal travel dropped by 38% to 48% during the work week.
-
Long haul truck travel showed its first signs of decline by Thursday 3/26, down 20% on Friday 3/27.
-
Local area commercial travel declined steadily throughout the week, reaching 16% on Friday 3/27.
-
San Francisco and Detroit’s personal travel have both dropped by nearly two-thirds overall.
-
Michigan had the largest statewide decrease in personal (56%) and long-haul truck (41%) travel.
 Source:
INRIX U.S. National Traffic Volume Synopsis: Issue #2 (March
21-27, 2020) / By Rick Schuman
The week of 3/21-3/27 saw further reductions in vehicular travel than the week of 3/14-3/20, both relative to the week of 2/22-2/28:
 Note: figures relative to 2/22-2/28/2020. Source:
INRIX U.S. National Traffic Volume Synopsis: Issue #2 (March
21-27, 2020) / By Rick Schuman
Metropolitan areas with the highest reductions for Friday 3/27 (relative
to Friday 2/22) include Detroit (down 62%), San Francisco (down 54%), Seattle
(down 52%), and New York City (down 48%). Note that San
Francisco was the first major city to ‘shelter-in-place’). These trends are
also illustrated in the chart below:
 Source:
TomTom Live Traffic Congestion March 16-21, 2020
How long the decrease in VMT will persist is uncertain, particularly in the face of lower gas prices, the upcoming summer driving season, and aversion to flying given social distancing. What we have seen historically, though, is that aftermarket spend is sustained on as automobile owners keep their vehicles longer. This may be even more pronounced given temporary shutdowns of motor vehicle factories
Have an industry market research question you’d like Mike to respond to? Email michael.chung@autocare.org for an opportunity to have it answered in a future article. We’re also in the process of planning a webinar to address key data points industry experts are watching during COVID-19, what they might mean for the auto care industry and data resources we’re making available to members during these uncertain times.

Michael Chung, Director, Market Intelligence
Ready to dive into market research? I provide the industry with timely information on key factors and trends influencing the health of the automotive aftermarket and serving as a critical resource by helping businesses throughout the supply chain to make better business decisions. More About Me

Market Insights with Mike is a series presented by the Auto Care Association's Director of Market Intelligence, Mike Chung, that is dedicated to analyzing market-influencing trends as they happen and their potential effects on your business and the auto care industry.
More posts
Content
-
[WATCH] Driver Behavior Trends and Their Impact on Parts and Service Opportunities
March 17, 2022This webinar analyzes driving behavior at the national, state, and local levels. Gain insights into: consumer behavior; driving patterns; and potential impacts on parts replacement, service and repair scheduling, vehicle age, and the car parc.
-
[WATCH] 2022 Business Outlook: Top Emerging Opportunities and Challenges
February 4, 2022This webinar explores need-to-know emerging opportunities and challenges for the coming year: current status of supply chain issues and what to expect in the year ahead and more.
-
[WATCH] How to Use Vehicle Miles Traveled to Better Your Bottom Line in 2022
December 3, 2021Vehicle Miles Traveled has been respected for years as a key indicator of aftermarket opportunities. Historically, planning has been limited to directional indicators but now aftermarket businesses can leverage more detailed insights on geographic differences as well as vehicle differences to more effectively take advantage of aftermarket opportunities.
