New Data Trends for 2021
I’m a child of the 80s. When my son sees me play video games like Galaxian and Wizard of Wor, he encourages me to move into the 21st century and try new games (Rust, Minecraft, anything on Steam).
Change is hard. We’re a month into the New Year, and the adage “the more things change, the more things stay the same” still resonates (Jean-Baptiste Alphonse Karr, circa 1848). Uncertainty continues to be a theme, and the opening lines of Hazy Shade of Winter still ring true:
Time, time time, see what's become of me … While I looked around for my possibilities (The Bangles)
Yes, this is from the 80s (remember Less than Zero?) and was a remake of Simon & Garfunkel’s original from 1968. As we have entered 2021, the prevailing uncertainties of 2020 and concerns for the future have not disappeared. Current songs like Quarantine Clean and Gold and Chrome reflect this, and the automotive aftermarket recognizes this as well.
As we approach the one-year mark for stay-at-home restrictions, the pandemic is not going away quietly – COVID-19 cases exceed 26.6 million and associated deaths are above 454,000 in the United States (as of Feb. 4, 2021, Johns Hopkins University). Not surprisingly, the pandemic’s impact on automotive aftermarket’s manufacturing side.
Manufacturing and Logistics
Parts manufacturers have faced challenges in keeping their factory floors fully staffed with qualified workers. While unemployment has been high, recruiting and hiring workers has been challenging, with e-commerce warehouses and fulfillment centers providing competition for workers. The Wall Street Journal reports, “In December, employers added 52,000 jobs related to online retailing, such as couriers, warehousing and trucking, versus 7,000 manufacturing motor vehicles and parts.”
Furthermore, if employees are absent for health-related reasons, including COVID-19 and corresponding isolation periods, factory production can be impacted considerably. Adding to the complexity of production management, manufacturers must be compliant with COVID-19 safety requirements, else be subject to penalties and citations from state Occupational Safety and Health Administration authorities. Such requirements for businesses that resume in-person work include a written COVID-19 preparedness and response plan, thorough training for employees that covers, at a minimum, workplace infection-control practices, proper use of personal protection equipment (PPE), steps that workers must take to notify the business or operation of any symptoms of COVID-19 or a suspected or confirmed diagnosis of COVID-19, and how to report unsafe working conditions (State of Michigan requirements available here).
We also saw the supply chain being challenged by crowding at ports of entry – particularly on the West Coast for Asian imports. The surge in imports in 2H2020 “stretched the resources and assets of the international supply chains of U.S. ports – vessel delays, excessive container dwell times on the terminals, equipment shortages, and lengthy truck turn times surfaced first in Southern California and continue today.” (Journal of Commerce). Cargo volumes through Los Angeles-Long Beach are expected to remain strong in 1Q2021, so it will be some time before the supply chain kinks are worked out.
Total U.S. imports from Asia last year rose 4.1% over 2019 to almost 16.6 million TEU (twenty-foot equivalent units), according to PIERS. Timing of cargo arrivals from Asia contributed to the challenge – 1H2020 was down 10.7% YoY while 2H2020 was up 16.9% – nearly 60% of all containerized goods from Asia entered the United States in 2H2020 versus 51% in 2H2019.
Those operational problems were the most intense at the ports of Los Angeles and Long Beach, which accounted for 49.5% of total U.S. imports from Asia, and was also the fastest-growing of the top three ports last year. Imports from Asia increased 6.3% in Los Angeles-Long Beach in 2020, including a 16.9% YoY jump in 2H2020 (Journal of Commerce).
More than 70% of U.S. imports from Asia in 2020 were concentrated in three gateways: Los Angeles-Long Beach, New York-New Jersey, and Savannah. A 6.3% YoY increase in Asian imports through Los Angeles and Long Beach helped the U.S. West Coast maintain a 61% share of U.S. imports from Asia” (Journal of Commerce).
On the other side of the country, U.S. import volume from Europe fell 6.3% to 2.2 million TEU, buoyed by increasing imports in 2H2020. Rates have risen slowly, increasing 6.4% in late January relative to late September, but 1% higher YoY. By contrast, headhaul trans-Pacific and Asia–Europe spot rates had skyrocketed 150% and 302% year over year, respectively, as of Jan. 22 (Journal of Commerce), reflective of the high import activities from Asia as noted above.
Continuing Uncertainties
Thankfully, several vaccines have been developed and are being administered – about 1.2 million per day (Figure 1 below), according to Our World in Data, with 27.5 million Americans receiving at least one dose so far (Washington Post). Still a long way to go, but not surprising given the logistical challenges of distributing, scheduling, and administering a fragile vaccine.
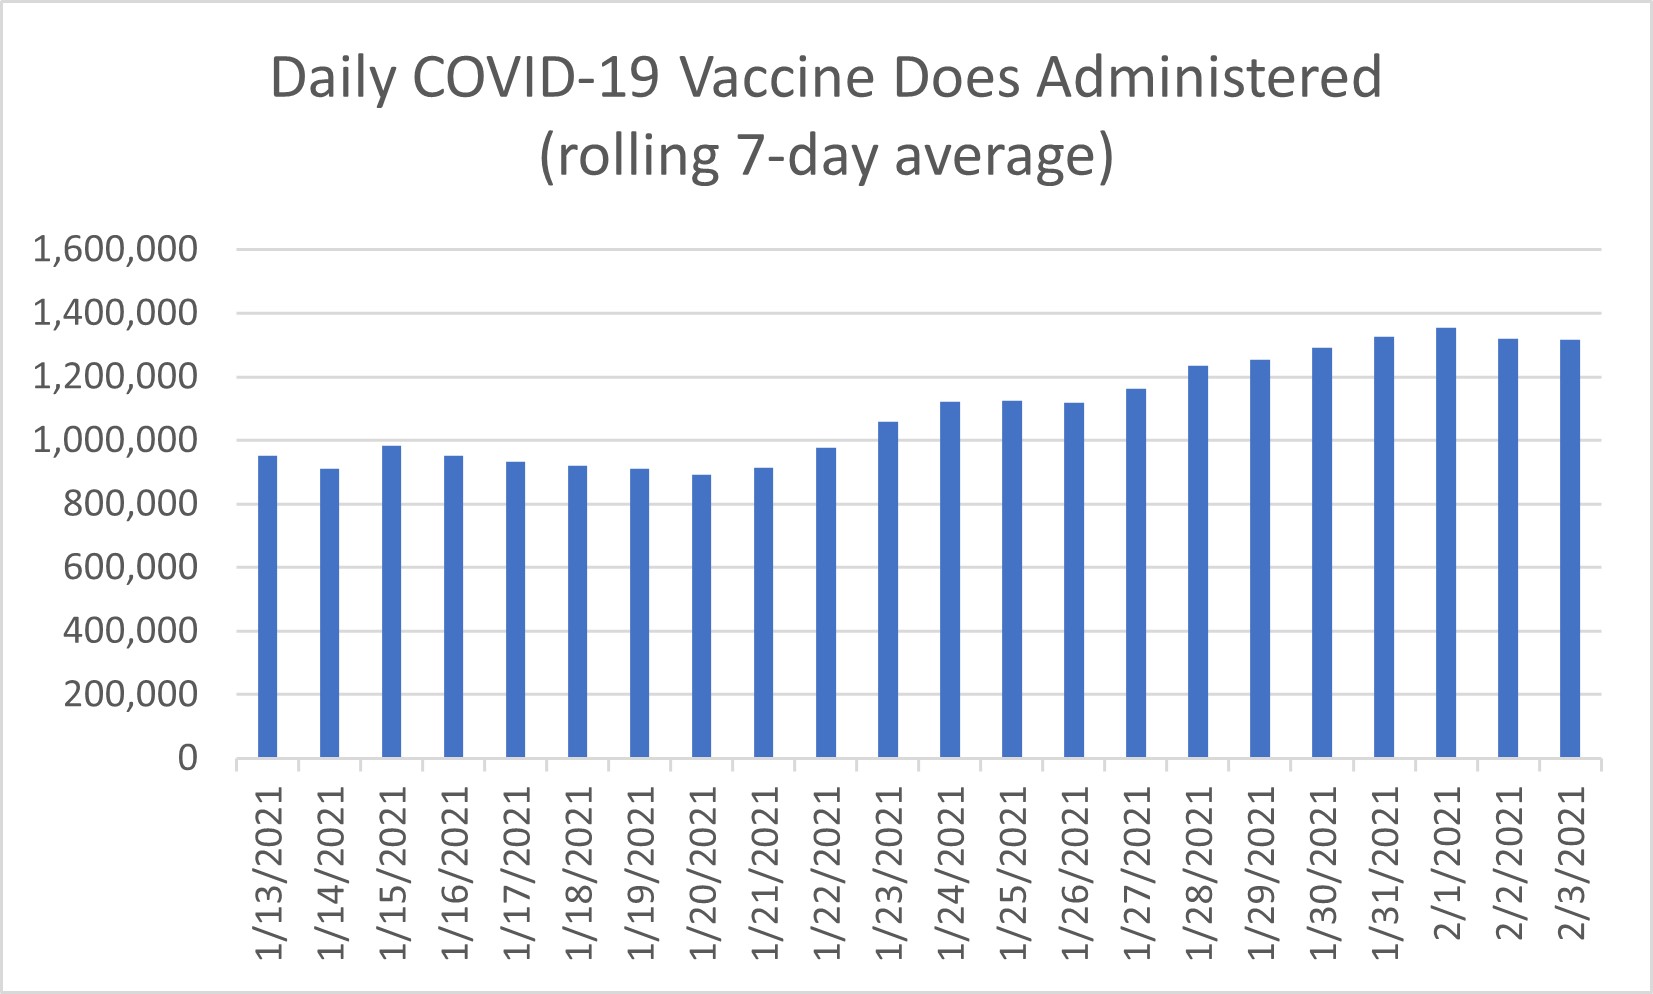
Figure 1 - Seven-Day Rolling Average of Vaccine Dose Administration
As the weeks tick by, we look ahead to continually moving targets of returning to school, returning to work, lifting restrictions on public gatherings, eating in restaurants. As of Feb. 1, 38% of U.S. K-12 schools are meeting in person every day, 38% meet virtually every day, and 24% are in a hybrid format (Burbio, Figure 2).
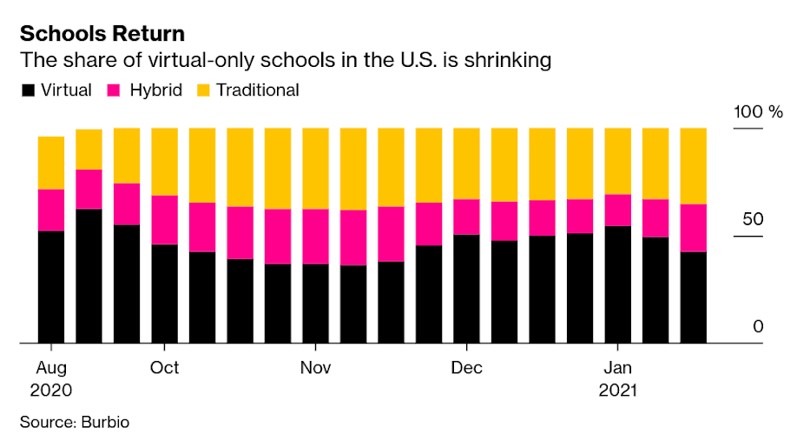
Figure 2 - Breakdown of School Sessions by Venue
Gartner reports that 80% of organizations surveyed are planning to allow remote work at least part of the time – nearly half of organizations (47 ) are considering full-time arrangements for workers, 43% are considering flex day arrangements, and 43% are considering flex hours.
No doubt this will have an impact on driving habits and total mileage – KPMG projects a reduction in U.S. light vehicle mileage of 110-270 billion miles/year, along with a reduction in VIO by 14 million by 2025. While somewhat alarming, these are forecasts, after all.
While the public health community is pessimistic of a rapid return to pre-COVID “normal” life because of the recent discovery and spread of variants of the COVID-19 virus – “the new variant … makes this a much harder problem,” says Marc Lipsitch of the Harvard T.H. Chan School of Public Health (read more here).
Modeling the Future?
And while human behavior is difficult to predict, an app has been developed to simulate “what different transmission and mitigation strategies can look like in university settings” (reported here, app available here).
While this model can be helpful for schools to determine whether “return to school” is safe and appropriate, and thus inform staging, we continue to look at “traditional” industry indicators. Vehicle Miles Traveled (VMT) continues to be of high interest as it is a bellwether for aftermarket activity – maintenance, repair, and accessory purchases correlate positively with VMT.
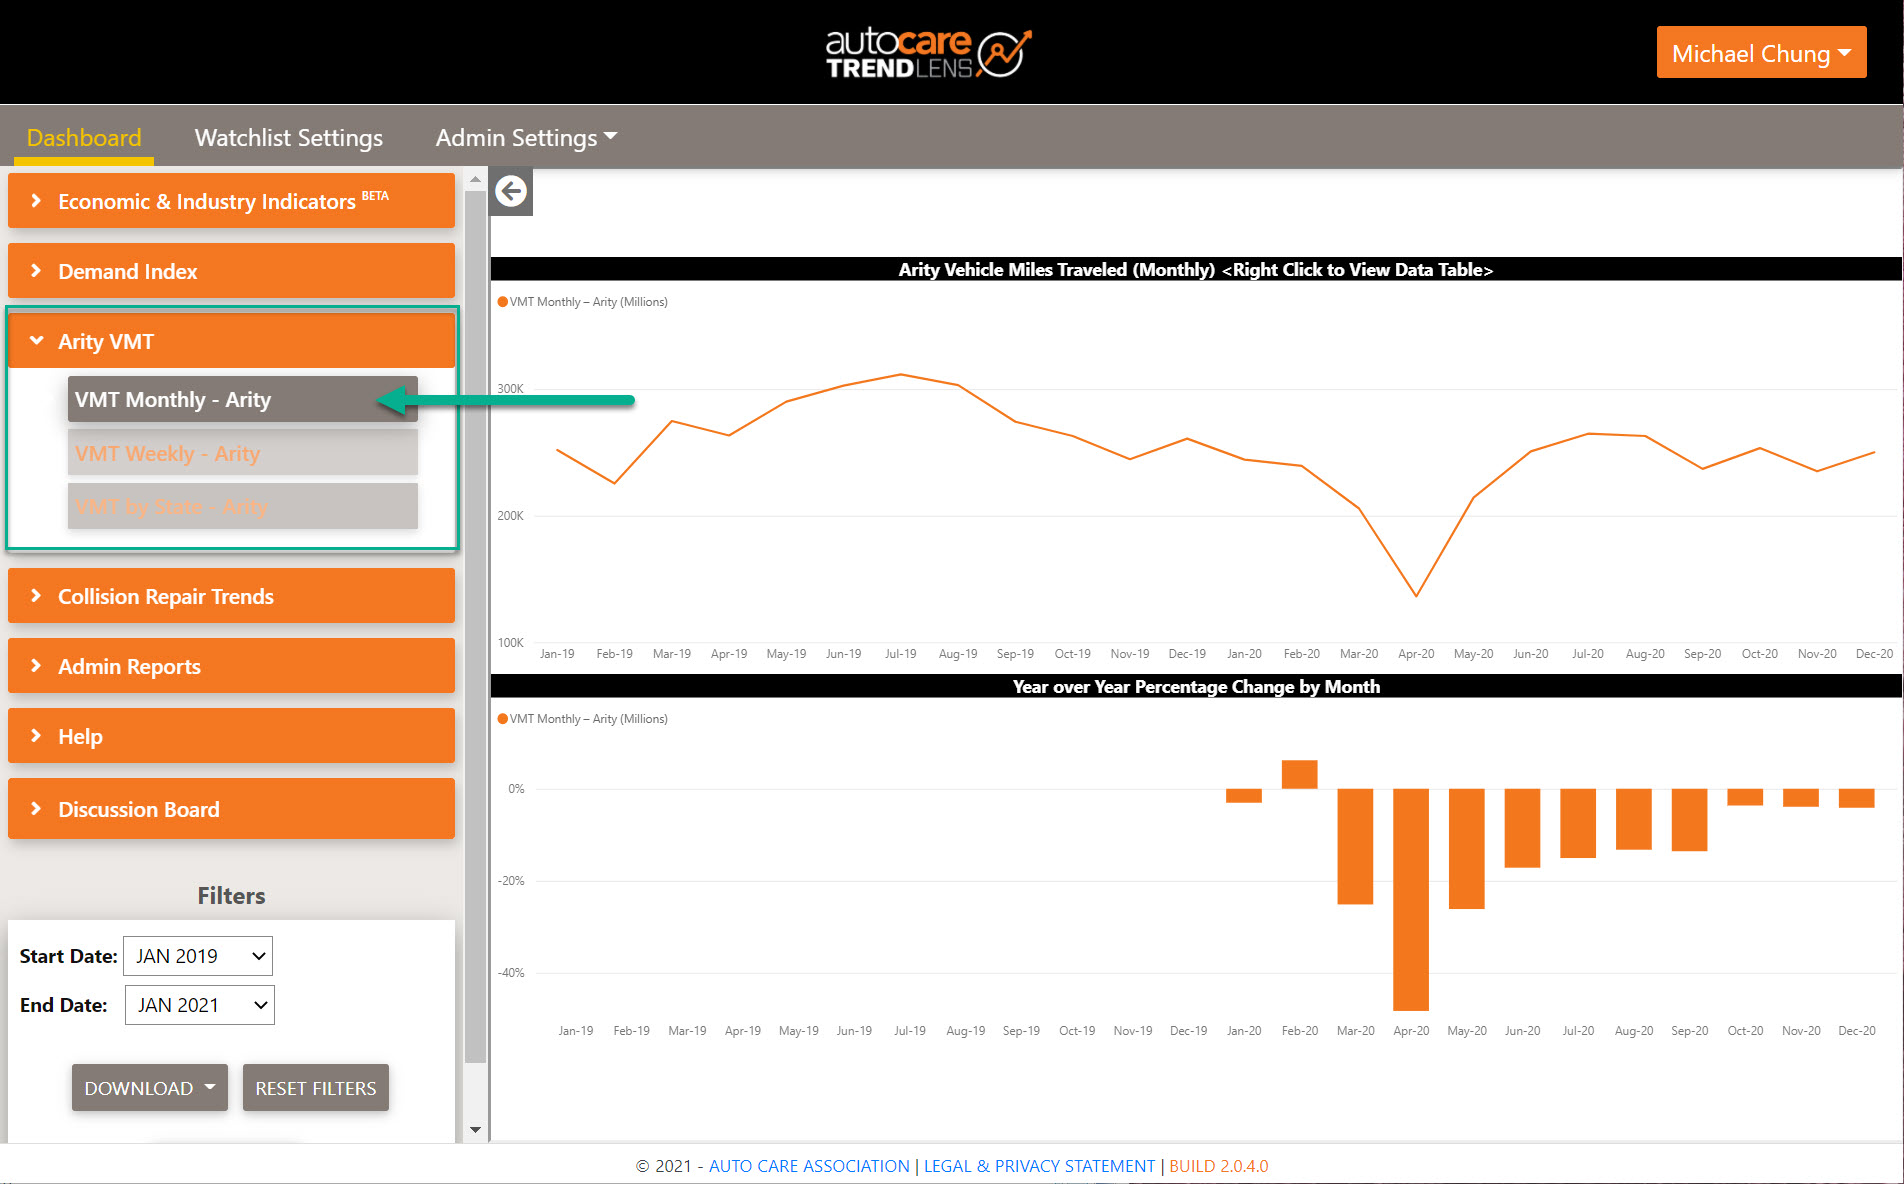
As announced recently, Auto Care’s partnership with Arity allows us to provide members with monthly national VMT data as soon as a calendar month ends – if you log in to TrendLens™, you will see VMT data for January 2021 under the “Arity Monthly VMT” channel:
Figure 3 - Arity Monthly VMT now available in TrendLens™
Arity is a wholly owned subsidiary of The Allstate Corporation. Mileage is calculated based on data collected from 23 million active connections from multiple third-party anonymized and aggregated sources, including consumer apps, insurance telematics mobile and device programs.
Monthly Arity VMT data goes back to January 2019, and when we compare it to U.S. DOT VMT data, they match quite well – in the chart below, the orange line represents Arity data while the gray line represents U.S. DOT data from January 2019 through December 2020.
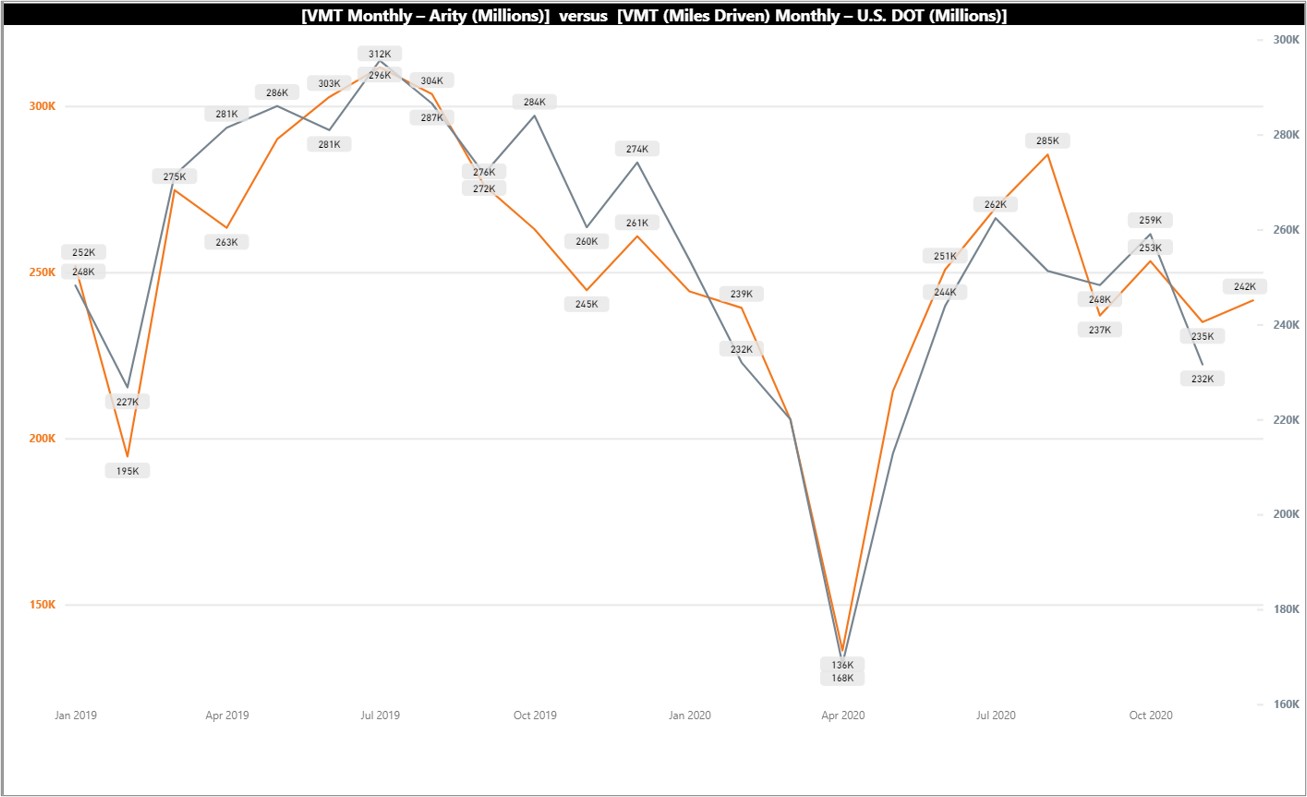
Figure 4 - Comparison of Arity VMT to U.S. DOT VMT
Last year I was asked frequently about the availability of VMT forecasts. While industry experts did not have a model ready to release to the public (so many unknowns, after all!), I think a good starting point could be to look at 2H2020.
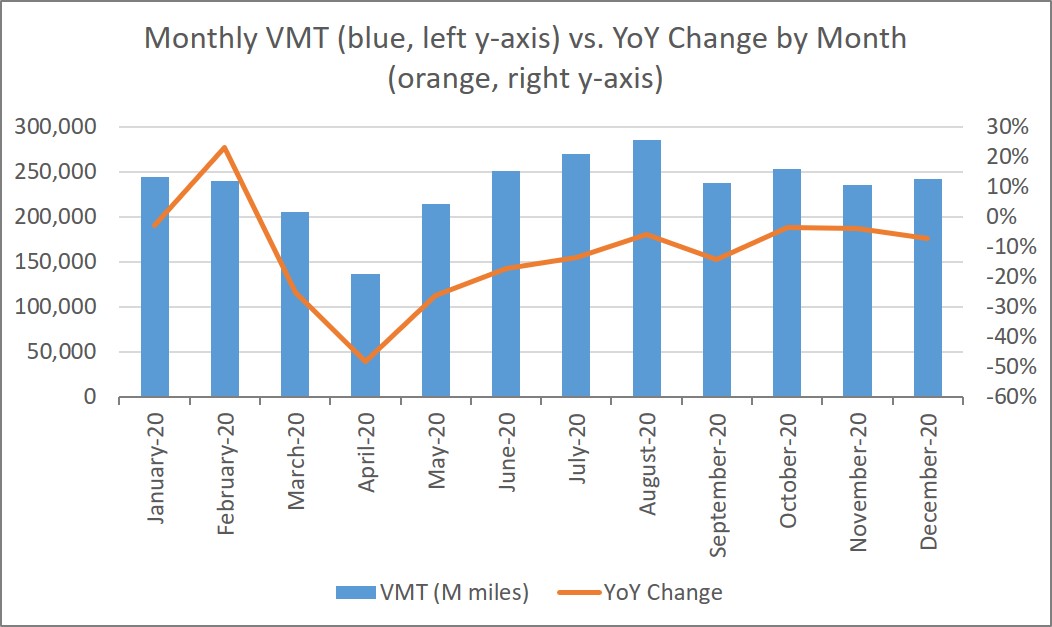
Figure 5 - 2020 Arity Vehicle Miles Traveled by Month
Based on Arity data, we saw 2020 total VMT for light vehicles was 13.1% lower than in 2019: What if 1H2021 is comparable to 2H2020? Looking at the monthly mileage below, this may be reasonable:
- We had relative stability from month to month in the second half of the year.
- Office workers worked from home in 2H2020 and continue to do so; as noted above, the vaccines are being administered gradually, so it seems unlikely that everyone will return to the office right away.
- We had summer and end-of-year holiday travel – mostly by car – last year, and we may see spring break and Easter holiday road trips in a few months.
Arity’s 2H2020 mileage was 17.9 higher than 1H2020 mileage. If 1H2021 VMT ends up being comparable to 2H2020, then the increased VMT would undoubtedly be a boost to the automotive aftermarket. Will shop owners see increased activity relative to a year ago? Is inventory management and corresponding communication with suppliers (and correspondingly, for wholesalers and distributors with manufacturers) as important as it was throughout the early days of the pandemic? Are you seeing the benefits of improved technology for managing your supply chain? Let us know what you’re seeing, and where you are seeing the fruits of your investments and adapted practices – we look forward to hearing what you’re seeing and how you’re continuing to adapt amidst the current market conditions.
Parting Thoughts
We draw a bit of data from our TrendLens™ platform – please access our collection of TrendLens™ training videos here.
As we have adjusted to home office life, several have incorporated a short drive or walk to enjoy the act of driving, as well as to have a cleaner separation of work life from home life, as documented here.
And as some have left the big cities, they have found alternative ways to create a sense of community – in particular, renting a larger home with other working professionals so as to have regular in-person contact while working remotely – read more here.
Read more Market Insights with Mike here.
 Mike Chung is director, market intelligence at Auto Care Association. With
more than a dozen years of experience in market research, Chung and his team
provide the industry with timely information on key factors and trends
influencing the health of the automotive aftermarket and serving as a critical
resource by helping businesses throughout the supply chain to make better
business decisions. Chung has earned several degrees, including a Bachelor of
Science in chemical engineering from Massachusetts Institute of Technology
(MIT), a Master of Science in environmental health management from Harvard
University and a Master of Business Administration with a concentration in
marketing from Montclair State University. Mike can be reached at
michael.chung@autocare.org.

Michael Chung, Director, Market Intelligence
Ready to dive into market research? I provide the industry with timely information on key factors and trends influencing the health of the automotive aftermarket and serving as a critical resource by helping businesses throughout the supply chain to make better business decisions. More About Me

Market Insights with Mike is a series presented by the Auto Care Association's Director of Market Intelligence, Mike Chung, that is dedicated to analyzing market-influencing trends as they happen and their potential effects on your business and the auto care industry.
More posts
Content
-
[WATCH] Driver Behavior Trends and Their Impact on Parts and Service Opportunities
March 17, 2022This webinar analyzes driving behavior at the national, state, and local levels. Gain insights into: consumer behavior; driving patterns; and potential impacts on parts replacement, service and repair scheduling, vehicle age, and the car parc.
-
[WATCH] 2022 Business Outlook: Top Emerging Opportunities and Challenges
February 4, 2022This webinar explores need-to-know emerging opportunities and challenges for the coming year: current status of supply chain issues and what to expect in the year ahead and more.
-
[WATCH] How to Use Vehicle Miles Traveled to Better Your Bottom Line in 2022
December 3, 2021Vehicle Miles Traveled has been respected for years as a key indicator of aftermarket opportunities. Historically, planning has been limited to directional indicators but now aftermarket businesses can leverage more detailed insights on geographic differences as well as vehicle differences to more effectively take advantage of aftermarket opportunities.

