Sharpen Your Forecast with Recent VMT Data
Welcome to 2023! I hope you each had a wonderful holiday season. Nearly three years ago COVID-19 was just beginning to enter the lexicon, changing the world as we know it, confirming the need for keeping a pulse on more data points more regularly.
Severe winter storms impacted much of the country over the holidays, disrupting travel for millions. The incidence of significant storms over the years is well documented. Eighteen natural 'billion-dollar disaster events' occurred - these include severe storms, floodings, and winter storms, among others, according to NOAA National Centers for Environmental Information (NOAA National Centers for Environmental Information). This is the eighth consecutive year that our country has endured at least 10 $1 billion weather-related disaster (The Washington Post).
We saw the impact on vehicle miles traveled (VMT): national VMT decreased by 3.15% from the week of Dec.11 to the week of Dec. 18, with the Midwest decreasing by 10.0% for the same period. Between school vacations, road closures (e.g., N.D. road closure announcement on Dec. 2 here) and travel bans (e.g., Niagara Falls, N.Y. travel ban on Dec. 23 here), it’s little surprise that VMT decreased over the holidays.
But in today’s modern age of business analytics and the need for tight supply chain control, the business case for more accurate and updated data is compelling. All Auto Care Association members have access to 46 Economic & Industry Indicators and Arity Monthly VMT data in our TrendLens™ data platform. TrendLens™ users with a Market View subscription have additional access to Arity Weekly VMT data and the ability to export this data, offering endless analytical possibilities.
Imagine the impact of reducing the mean absolute percentage error of your sales forecasts by 10% by incorporating weekly/regional VMT data into your service demand model.
Many association members are incorporating data from our TrendLens™ platform into their own proprietary models to forecast demand. The ROI for a $1,200/year corporate upgrade to the Market View subscription is staggering.
In viewing recent monthly Economic and Industry Indicator data, here are a few noteworthy observations:
- The average retail price of gasoline in December 2022 was $3.32/gallon, 12.5% lower than in November and the lowest since June 2021.
- Growth of credit card and evolving consumer loans is accelerating: outstanding unsecured U.S. consumer loans grew by 29% over a 19-month period from its most recent low point in April 2021 to $938 million in November 2021.
I asked Daniel Zenko, director, data innovation, Auto Care Association, why this is significant. He indicated that it took 43 months to increase by 29% to the previous December 2019 high of $873 million. “While a portion of the increase can be attributed to inflation, which had a cumulative rate of 11.48% over the same period, the trend accelerated with November’s 1.6% month-over-month growth, while October’s growth rate was 1.1%. December is usually the strongest spending month of the year so we expect that the trend’s sharp growth will continue."
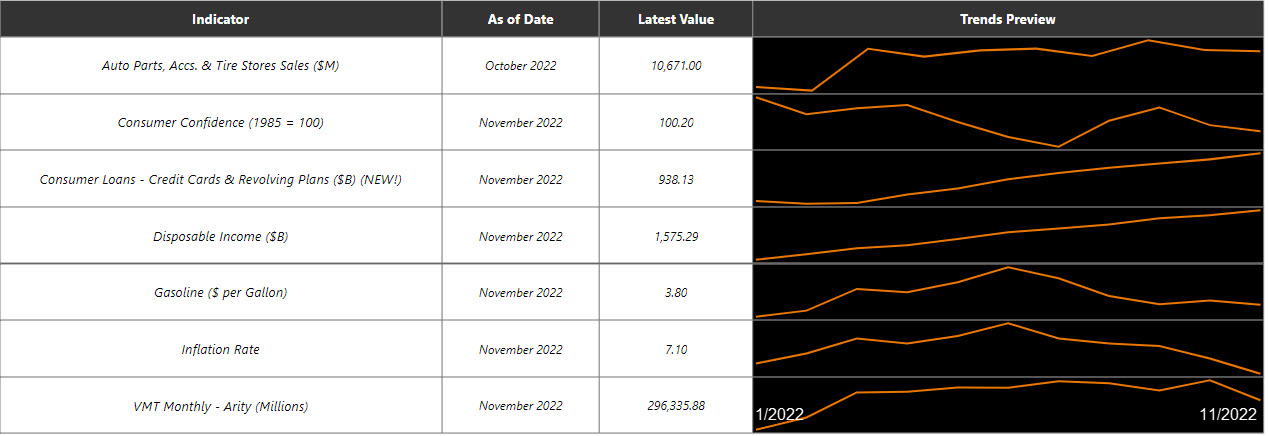
What does this mean for consumer spend? While recession concerns loom and tech layoffs are in the news, the seasonally adjusted layoffs and discharges in November were comparable with the previous month and year, and lower than pre-pandemic levels (The Wall Street Journal). The chart below tracks aftermarket retail sales, consumer confidence, consumer loans, disposable income, gas prices, inflation and Arity VMT from January through November 2022:

I expect the aftermarket to continue to do well. We’ve continued to outperform expectations since the pandemic began, and the industry has adapted deftly. Owners have continued to maintain their vehicles, with some understandable delay consequential to evolving traffic patterns:

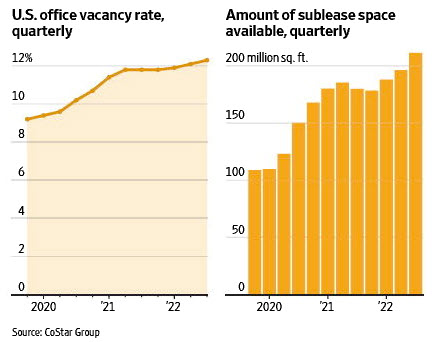
Those driving patterns look like they’ll continue for a bit. While a variety of companies are requiring employees to return to the office (The Wall Street Journal), office vacancy rates have inched upwards from 9.2% at the end of 2019 to 12.3% at the end of September 2022, according to CoStar Group Inc. (The Wall Street Journal).
If you haven’t used TrendLens™, check out some of our training videos here (just a few minutes for each tutorial under “The Basics” and “Economic & Industry Indicators”) and our “office hours” sessions on topics like leading indicators and correlation analysis.
Feel free to drop me a line via email if you have questions and sign up here for a live demo with yours truly.

Welcome to the new YANG Effect! Your one-stop quarterly newsletter for all things Automotive Aftermarket contributed to and written by under-40 industry professionals.
More posts

Market Insights with Mike is a series presented by the Auto Care Association's Director of Market Intelligence, Mike Chung, that is dedicated to analyzing market-influencing trends as they happen and their potential effects on your business and the auto care industry.
More posts
