
Pricing Trends and Influences Amidst a Shocked Supply Chain
Welcome to fall – it’s been a few months since my last column, and I hope you are doing well amidst a continually dynamic economy and as year-end approaches (gulp, is it really Q4 already?).
High-Demand Parts and Commodity Prices
Early in the 2000s, Acura’s high intensity discharge headlamps were a hot commodity – thieves were pilfering these parts in New York City, presumably to trick out Civics and Integras a la Fast and the Furious. These days, catalytic converters are the target of choice – they command high prices on the black market since they contain platinum (3-7 grams) and palladium. Annual thefts more than quadrupled from 2019 (3,389) to 2020 (14,433), based on National Insurance Crime Bureau statistics, and legislation has been implemented in Wisconsin to require individuals to show identification and ownership when selling to scrap yards. Toyota Priuses (higher precious metal content) and pickup trucks (easier access) tend to be hit more frequently.
Commodity prices for platinum moved from $799.40/ounce on Jan. 1, 2019 to $973.10 on Dec. 31, 2019. While it dipped as low as $601.60 in 2020 (March 19) but rose to $1,078.50 by Dec. 31, 2020. Prices in 2021 have stayed high, peaking at $1,319.70 on Feb. 15 as indicated in the chart below (left). Spot prices for palladium have moved in a similar fashion, peaking at $3,014.50 on May 4, 2021 (right).

Platinum (L) and Palladium (R) Spot Prices, Jan. 1, 2019 – Oct. 11, 2021, APMEX.
Perhaps not surprisingly, the price curves above follow the theft curves below:
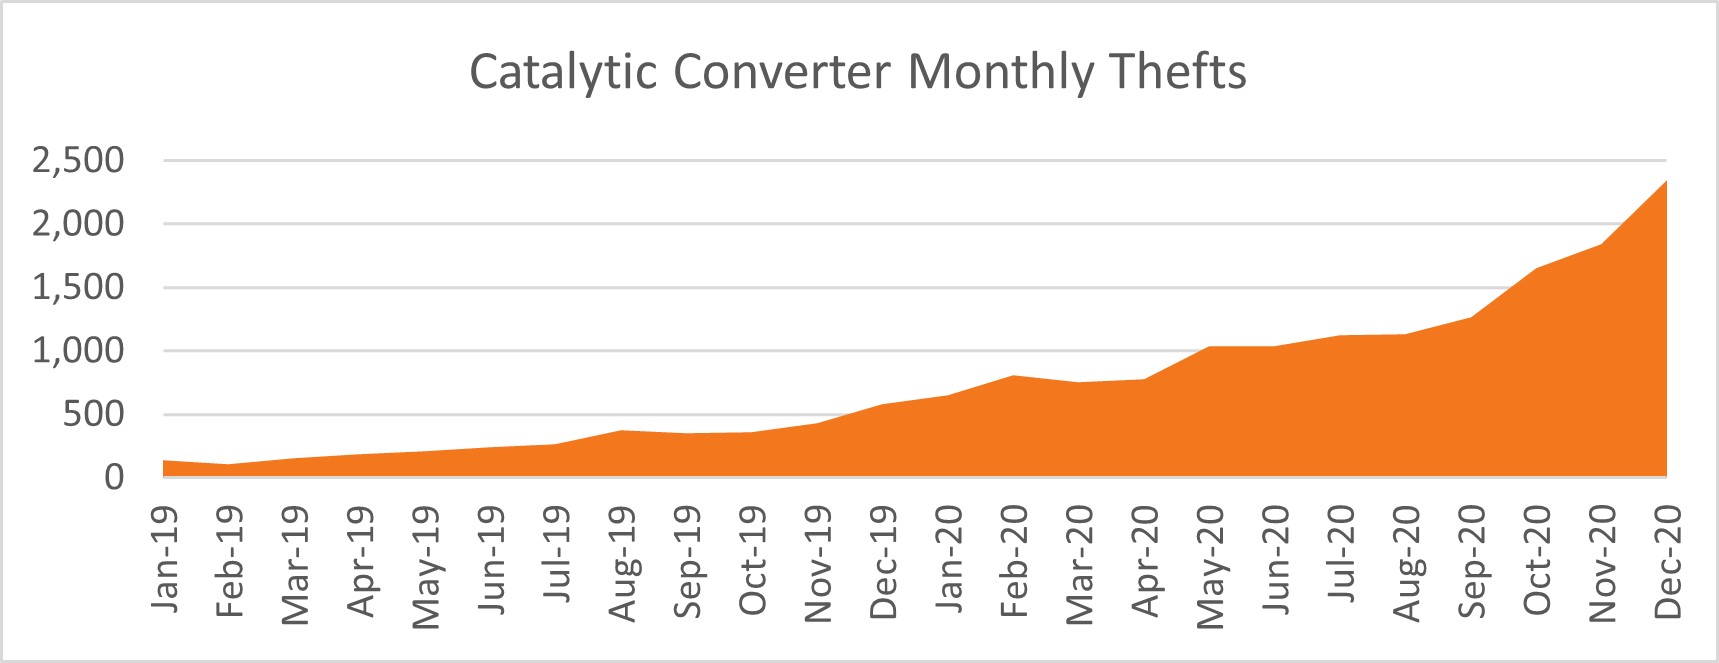
Source: National Insurance Crime Bureau
While producer prices for metals and metal products (3rd row below) and motor vehicle parts (6th row) were fairly flat throughout 2020, both increased substantially in 2021.
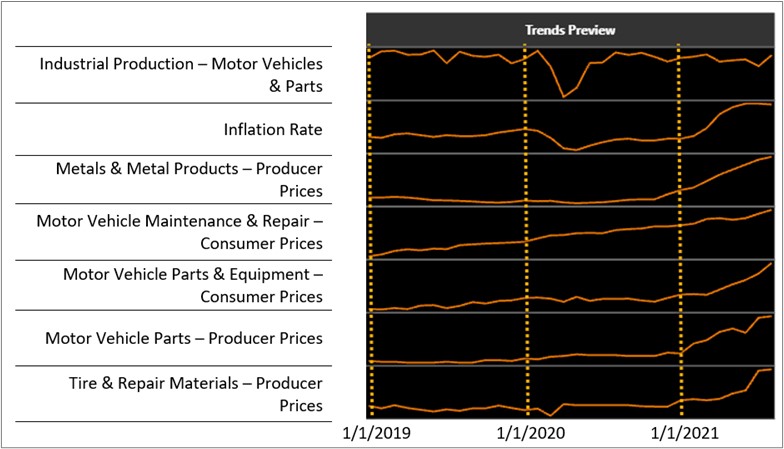
“Dashboard Data” view of selected economic and industry indicators. TrendLensTM.
These two variables have a strong positive correlation (Pearson correlation coefficient = 0.84, a recent addition to TrendLensTM):
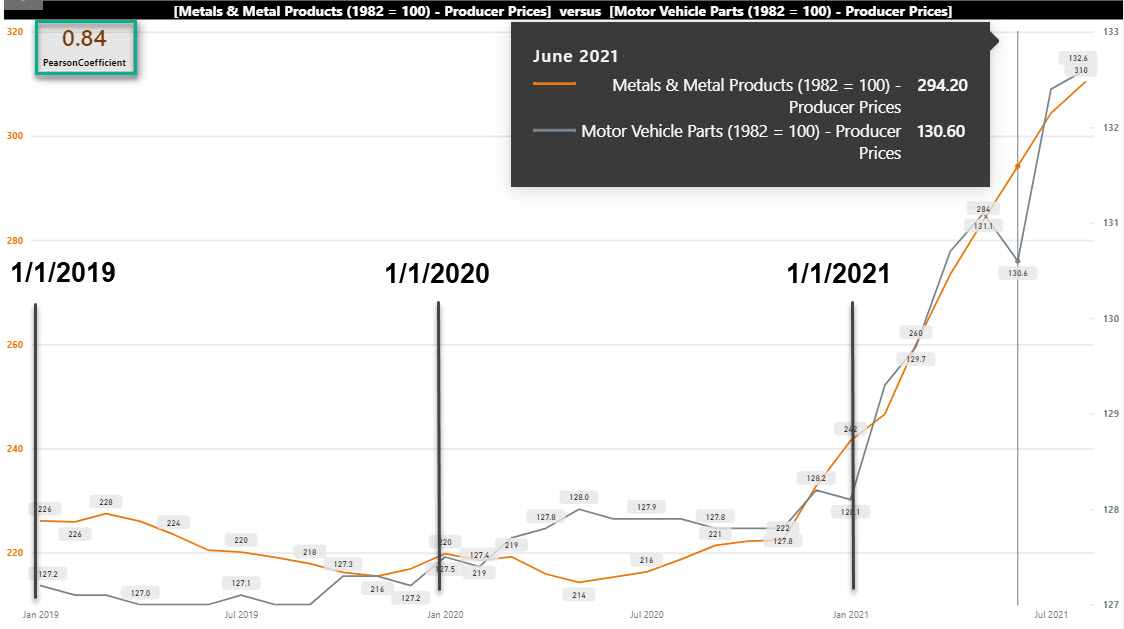
“Trends Comparison” view of producer prices for Metals & Metal Products (orange) and Motor Vehicle Parts (gray). TrendLensTM.
Supply Chain Woes
You know things are bad when the executive director of the American Christmas Tree Association says, “If I can give one piece of advice to consumers right now, it is to find and buy your Christmas tree early,” (The Wall Street Journal). Industry experts now foresee supply chain snafus to last through 2022 (The Washington Post).
The chart below illustrates total U.S. business inventories from January 2016 through July 2021. The gold call-outs are for October and November. I would be surprised if the levels for October-November 2021 will be as pronounced.
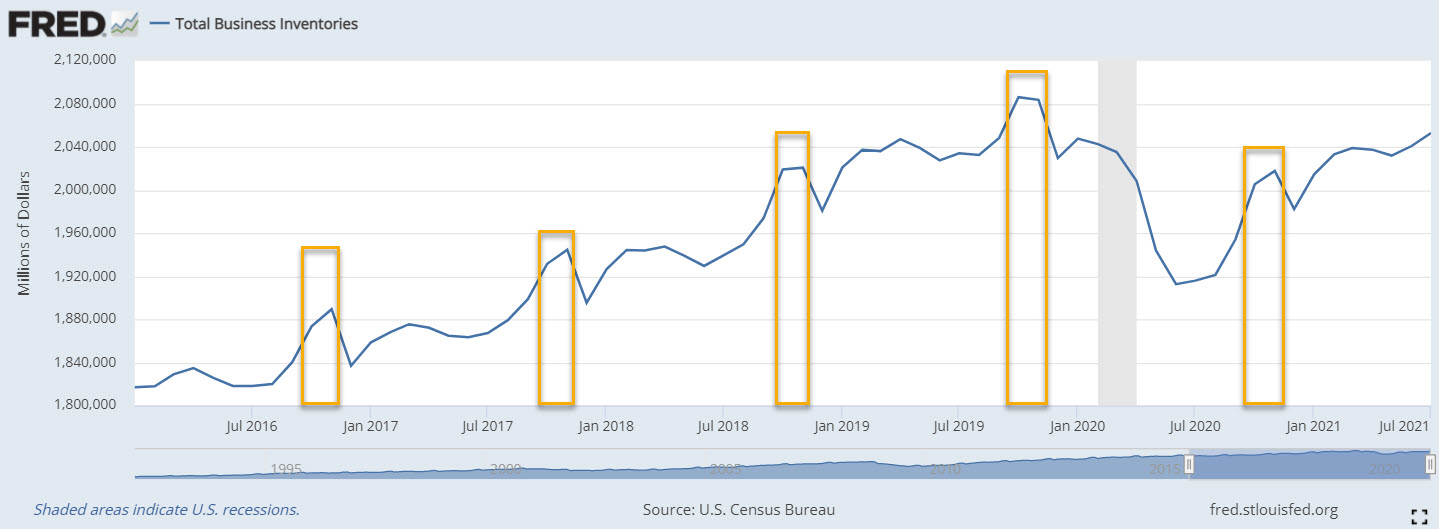
U.S. Census Bureau, Total Business Inventories, retrieved from FRED, Federal Reserve Bank of St. Louis, October 14, 2021.
While inventories have increased since Summer 2020, businesses are likely to face challenges in having enough inventory to meet consumer demand this holiday season. This will cause friction for customers as they purchase scarcer products; a potential supply shortage could also lead to price increases. The chart below displays retailer inventory to sales ratios from January 2016, with the gold arrows pointing to December for each year.
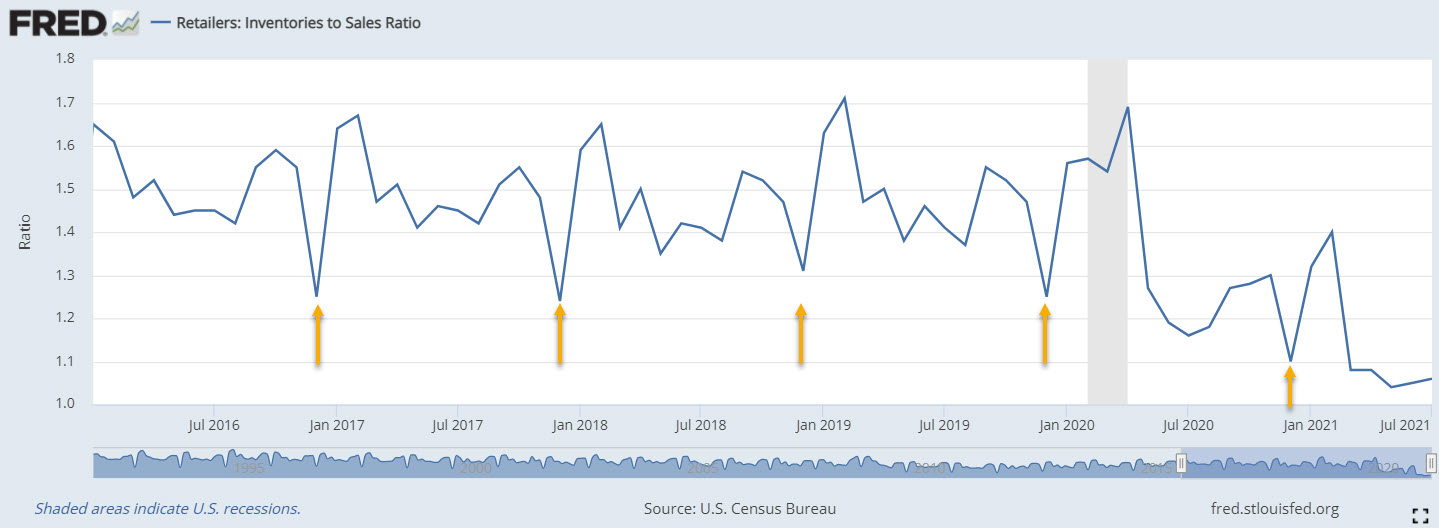
U.S. Census Bureau, Retailers: Inventories to Sales Ratio, retrieved from FRED, Federal Reserve Bank of St. Louis; October 14, 2021.
With inflation on the minds of many consumers, higher prices may result not only from product shortages, but also from higher shipping costs. The chart below shows the cost of shipping a container from China/East Asia to North America West Coast:
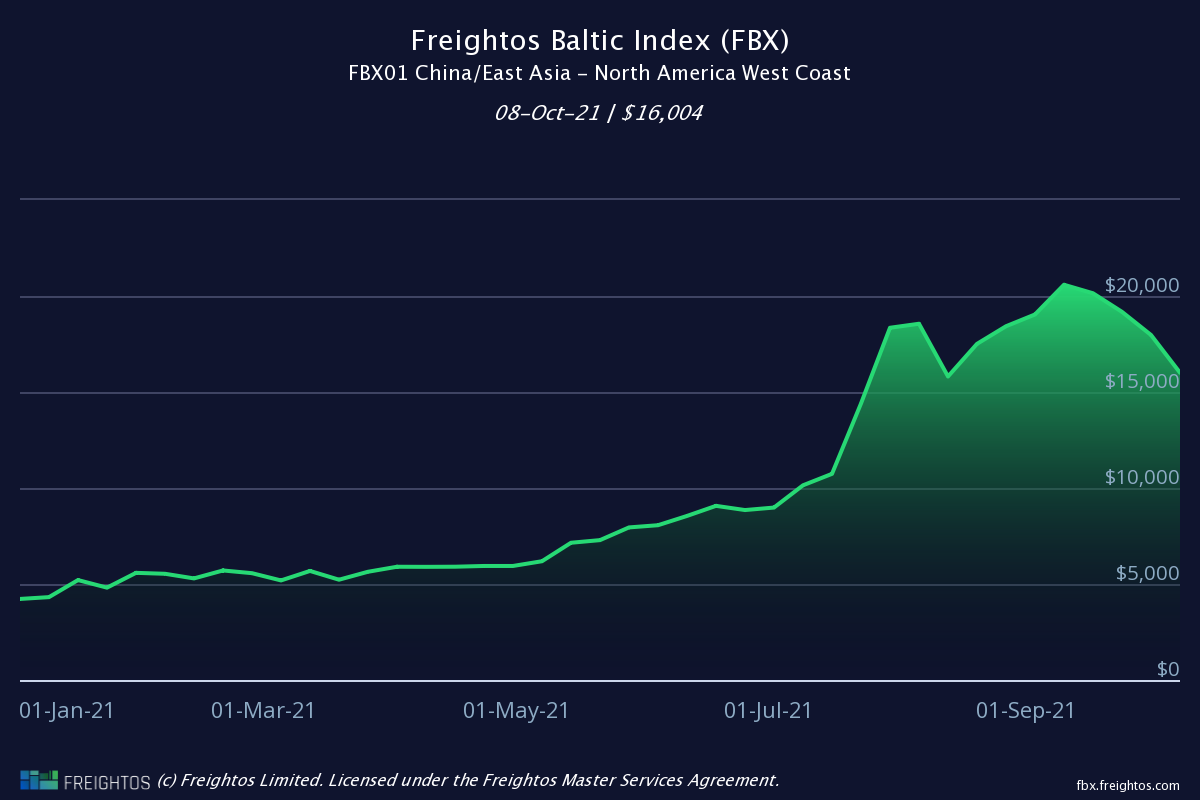
FBX01: China/East Asia to North America West Coast, Freightos
Shipping across the Atlantic has similarly increased sharply – according to Freightos, shipping freight from North Europe to North America’s East Coast has risen nearly fourfold – from $1,881 in January 2021 to $7,117 in October.
At some point, those costs have to get passed along to the consumer. The question is, when? How much will distributors, suppliers, and retailers be willing to absorb in order to maintain customer loyalty? Inflation has risen from 1.4% in January to 5.3% in August (orange line in chart below). The gray line is aftermarket retail sales (auto parts, accessories, and tire stores).
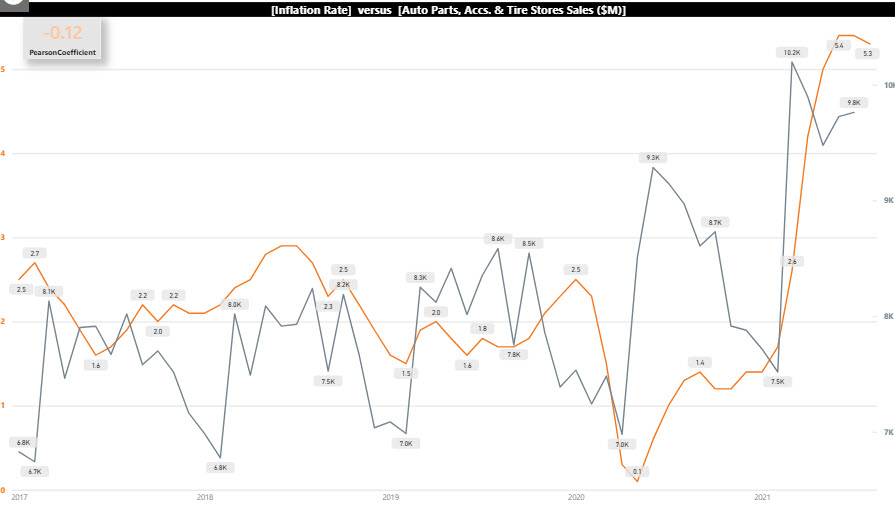
Inflation (orange) vs. Automotive Aftermarket Retail (gray), Jan. 2017-August 2021. TrendLensTM.
While the two lines appear to run “together”, this can be deceptive – the correlation is weakly negative (Pearson correlation coefficient = -0.12; 0.7 or greater is considered “strong”).
Of course – if prices are higher, sales are higher … given the same quantity sold. But are they buying from you or someone else? What drives your customers to choose you over a competitor? Price, quality, timeliness, customer service?
And, are your customers driving the same amount and in the same way?
Driving Patterns
Yes and no, according to Arity. While total national light vehicle mileage has returned, and even exceeded 2019 levels, a number of interesting findings have emerged, including:
- Total mileage has risen, but the number of drivers has decreased.
- Fewer drivers has allowed for higher speeds and fewer hard braking events.
- Driving patterns vary across urban, suburban, and rural settings.
With many still working from home, roads are less congested during “typical” pre-pandemic rush hour traffic – the reduced stop and go patterns have been confirmed with fewer hard braking events. Since there are fewer vehicles on the road, people have been able to go faster – “almost 1 out of every 20 miles is driven at speeds over 80 MPH, compared to 1 out of every 25 miles in 2019.”
National trends are important, and local trends are even better, right?
COMING SOON – New Demand Index Feature – Geo4 Data
Demand Index subscribers will be able to see indexed point of sales data by geographic region in early November. All the better as you’re managing inventory and anticipating customer demand. Users will see the “Regional Report” option pictured below (upper left).
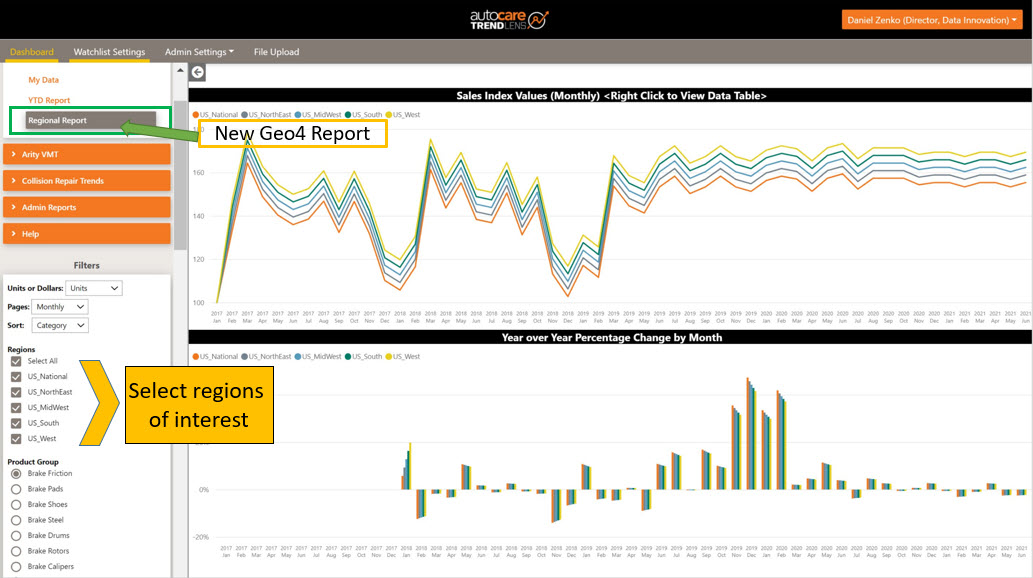
Demand Index, Regional Report (coming soon - data above are fictitious and for illustrative purposes only). TrendLensTM.
In the example above, the lines in the top chart represent national and regional point-of-sale data for brake friction from January 2017 to June 2021 (note: data is fictitious and for illustrative purposes only). In the left menu, users can select regions of interest and track historic sales for more than 70 product categories.
We will also introduce regional data for selected economic and industry indicators. Visit us at the Auto Care Data Innovation Center in the Sands Upper Lobby to see how TrendLensTM will allow you to see key Economic and Industry Data, and Demand Index Product Groups regionally. We are confident that the additional layer of data will be valuable for you as you navigate the turbulent economic environment and make better business decisions.
One Last Thing …
We spoke with an industry-wide panel of industry experts to discuss “Data Sources and Application Amidst an Evolving Economy and Industry” – the webinar will be available here for your viewing, and we will also have a live panel discussion at AAPEX on Thursday, Nov. 4 at 10 a.m. local time in Las Vegas, Nev. – mark your calendar and join us there!
Arity is a wholly owned subsidiary of The Allstate Corporation. Mileage is calculated based on data collected from 23 million active connections from multiple third-party anonymized and aggregated sources, including consumer apps, insurance telematics mobile and device programs.

Welcome to the new YANG Effect! Your one-stop quarterly newsletter for all things Automotive Aftermarket contributed to and written by under-40 industry professionals.
More posts

Market Insights with Mike is a series presented by the Auto Care Association's Director of Market Intelligence, Mike Chung, that is dedicated to analyzing market-influencing trends as they happen and their potential effects on your business and the auto care industry.
More posts
