
Automotive Aftermarket Looks Promising Despite Low Consumer Confidence
The Takeaways
[Not AI-Generated!]
Key points: Near-term automotive aftermarket continues to look promising:
- For the past several years, consumer confidence has been low, for a variety of reasons, while vehicle miles traveled (VMT) has held steady since 2023
- Consumer confidence is more highly correlated with light truck and new car dealers sales
- Ford and GM have walked back their EV goals as they look to expand lower-priced offerings, something that has been missing in the U.S. market (cue the EV report)
The Intro: Consumer Confidence Remains Low
2025 has been a tough year for consumers. Figure 1 below tracks consumer confidence from January 2022 through November 2025. The green line reflects overall confidence based on three inputs:
- Job Market (red): 37% of consumers think it’s very or somewhat difficult to find employment in the current job market
- Household Finances (blue): 46% of consumers say their household’s current financial situation is good or very good
- Spending Comfort (yellow): 39% of consumers are very or somewhat comfortable spending money now on discretionary purchases
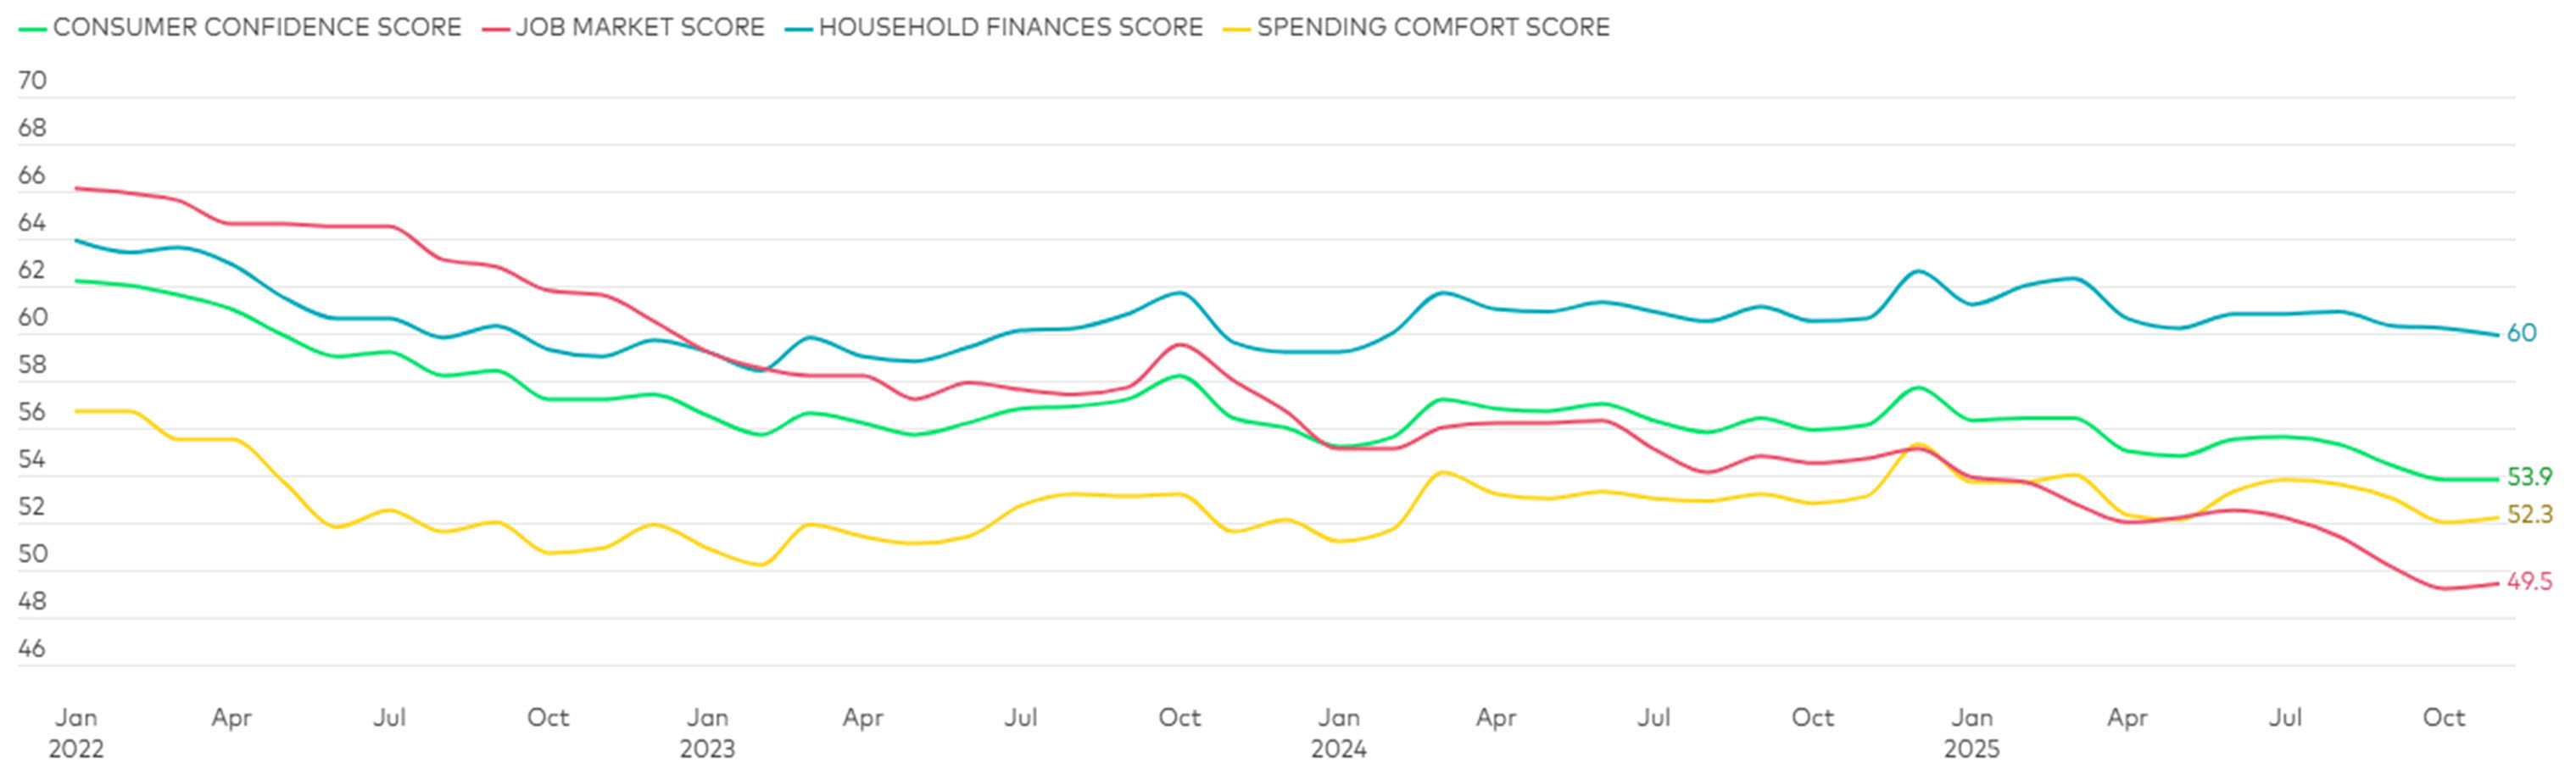
Figure 1: Consumer Confidence since January 2022
Source: Numerator
All makes sense, right? 2025 has been the year of tariffs, sustained inflation, and professional service workers’ concerns of the [neologism alert] AI-ification of jobs. To that point, The Wall Street Journal reported, “Americans with bachelor’s degrees or higher put the average probability of losing their jobs in the next year at 15%, up from 11% three years ago, according to November data from the Federal Reserve Bank of New York. Workers in this group now think losing a job is more likely than those with less education do." [1]
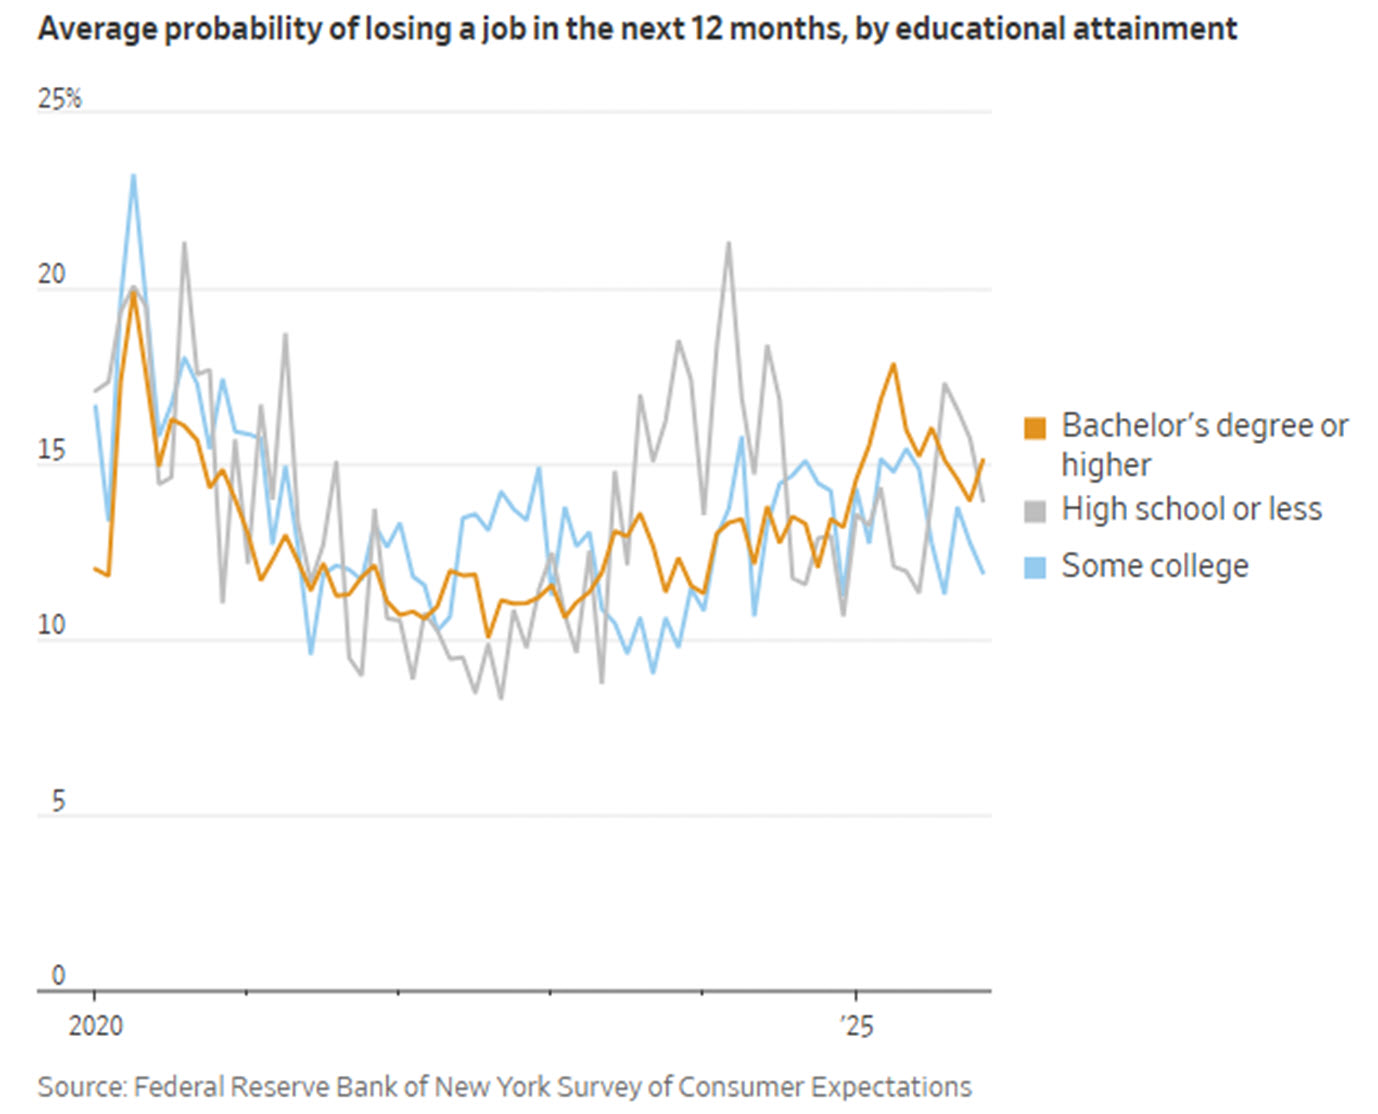
Figure 2: Probability of Job Loss in Next 12 Months
Source: The Wall Street Journal, Dec. 18, 2025
That sentiment complements the lower number of job openings for software development relative to overall jobs on Indeed:
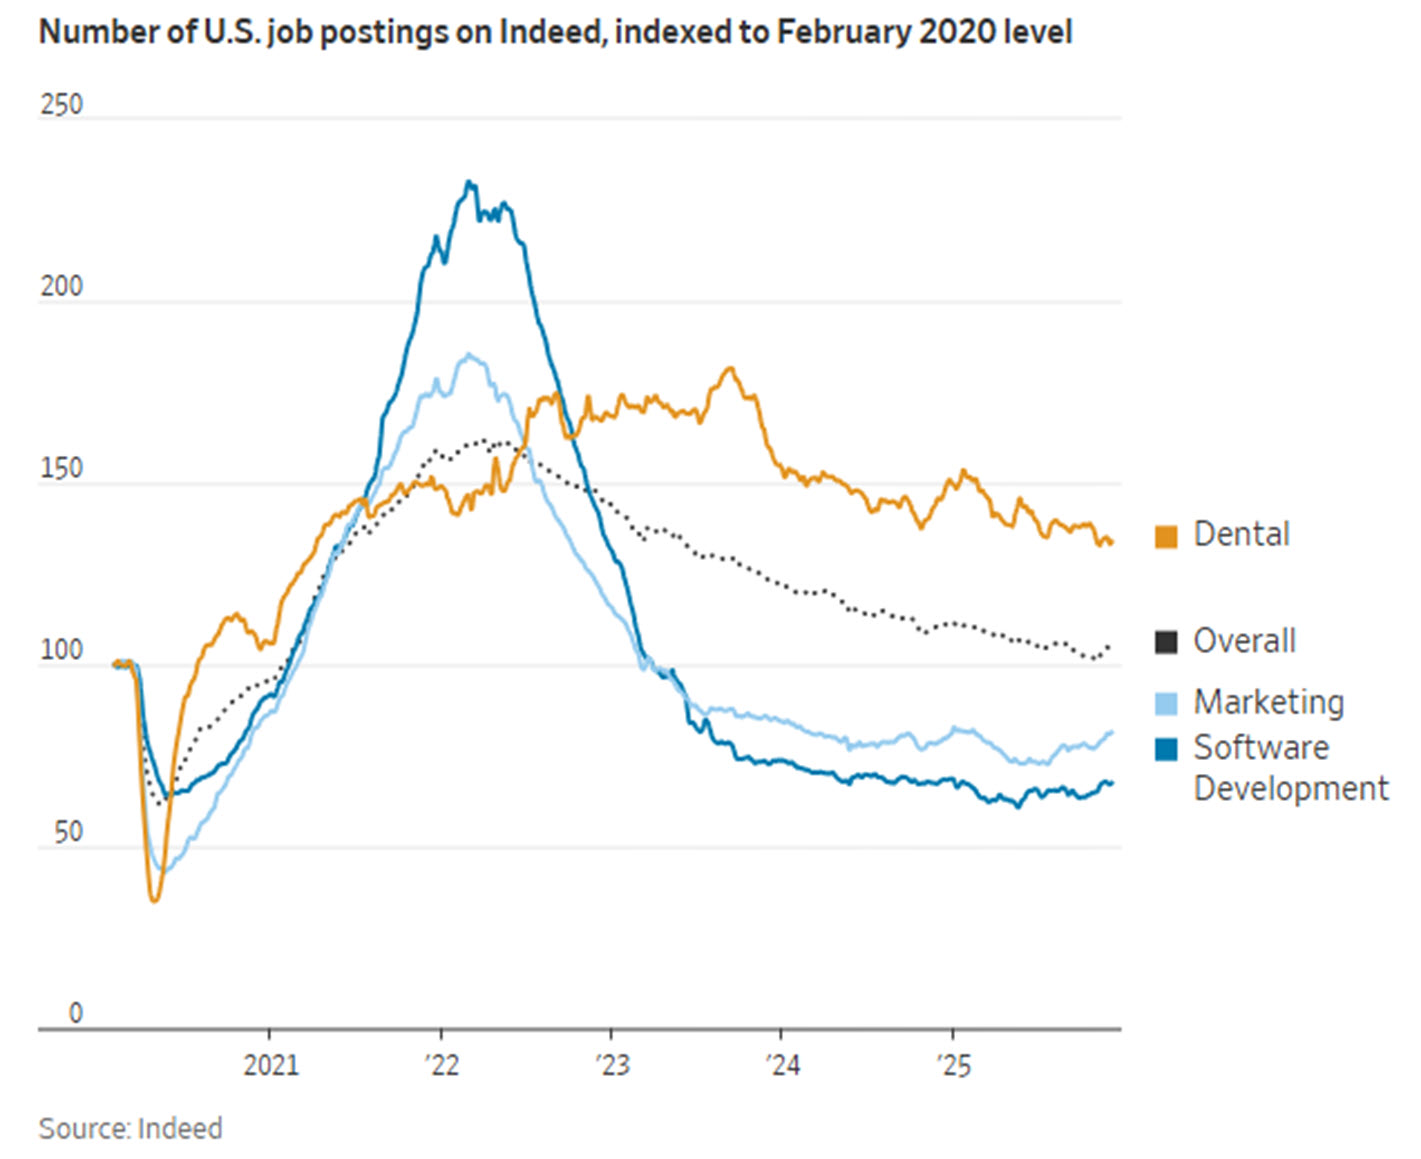
Figure 3: Indeed Job Postings
Source: The Wall Street Journal, Dec. 18, 2025
The Data Slog: Correlations
[AKA the TrendLens® Promotional]
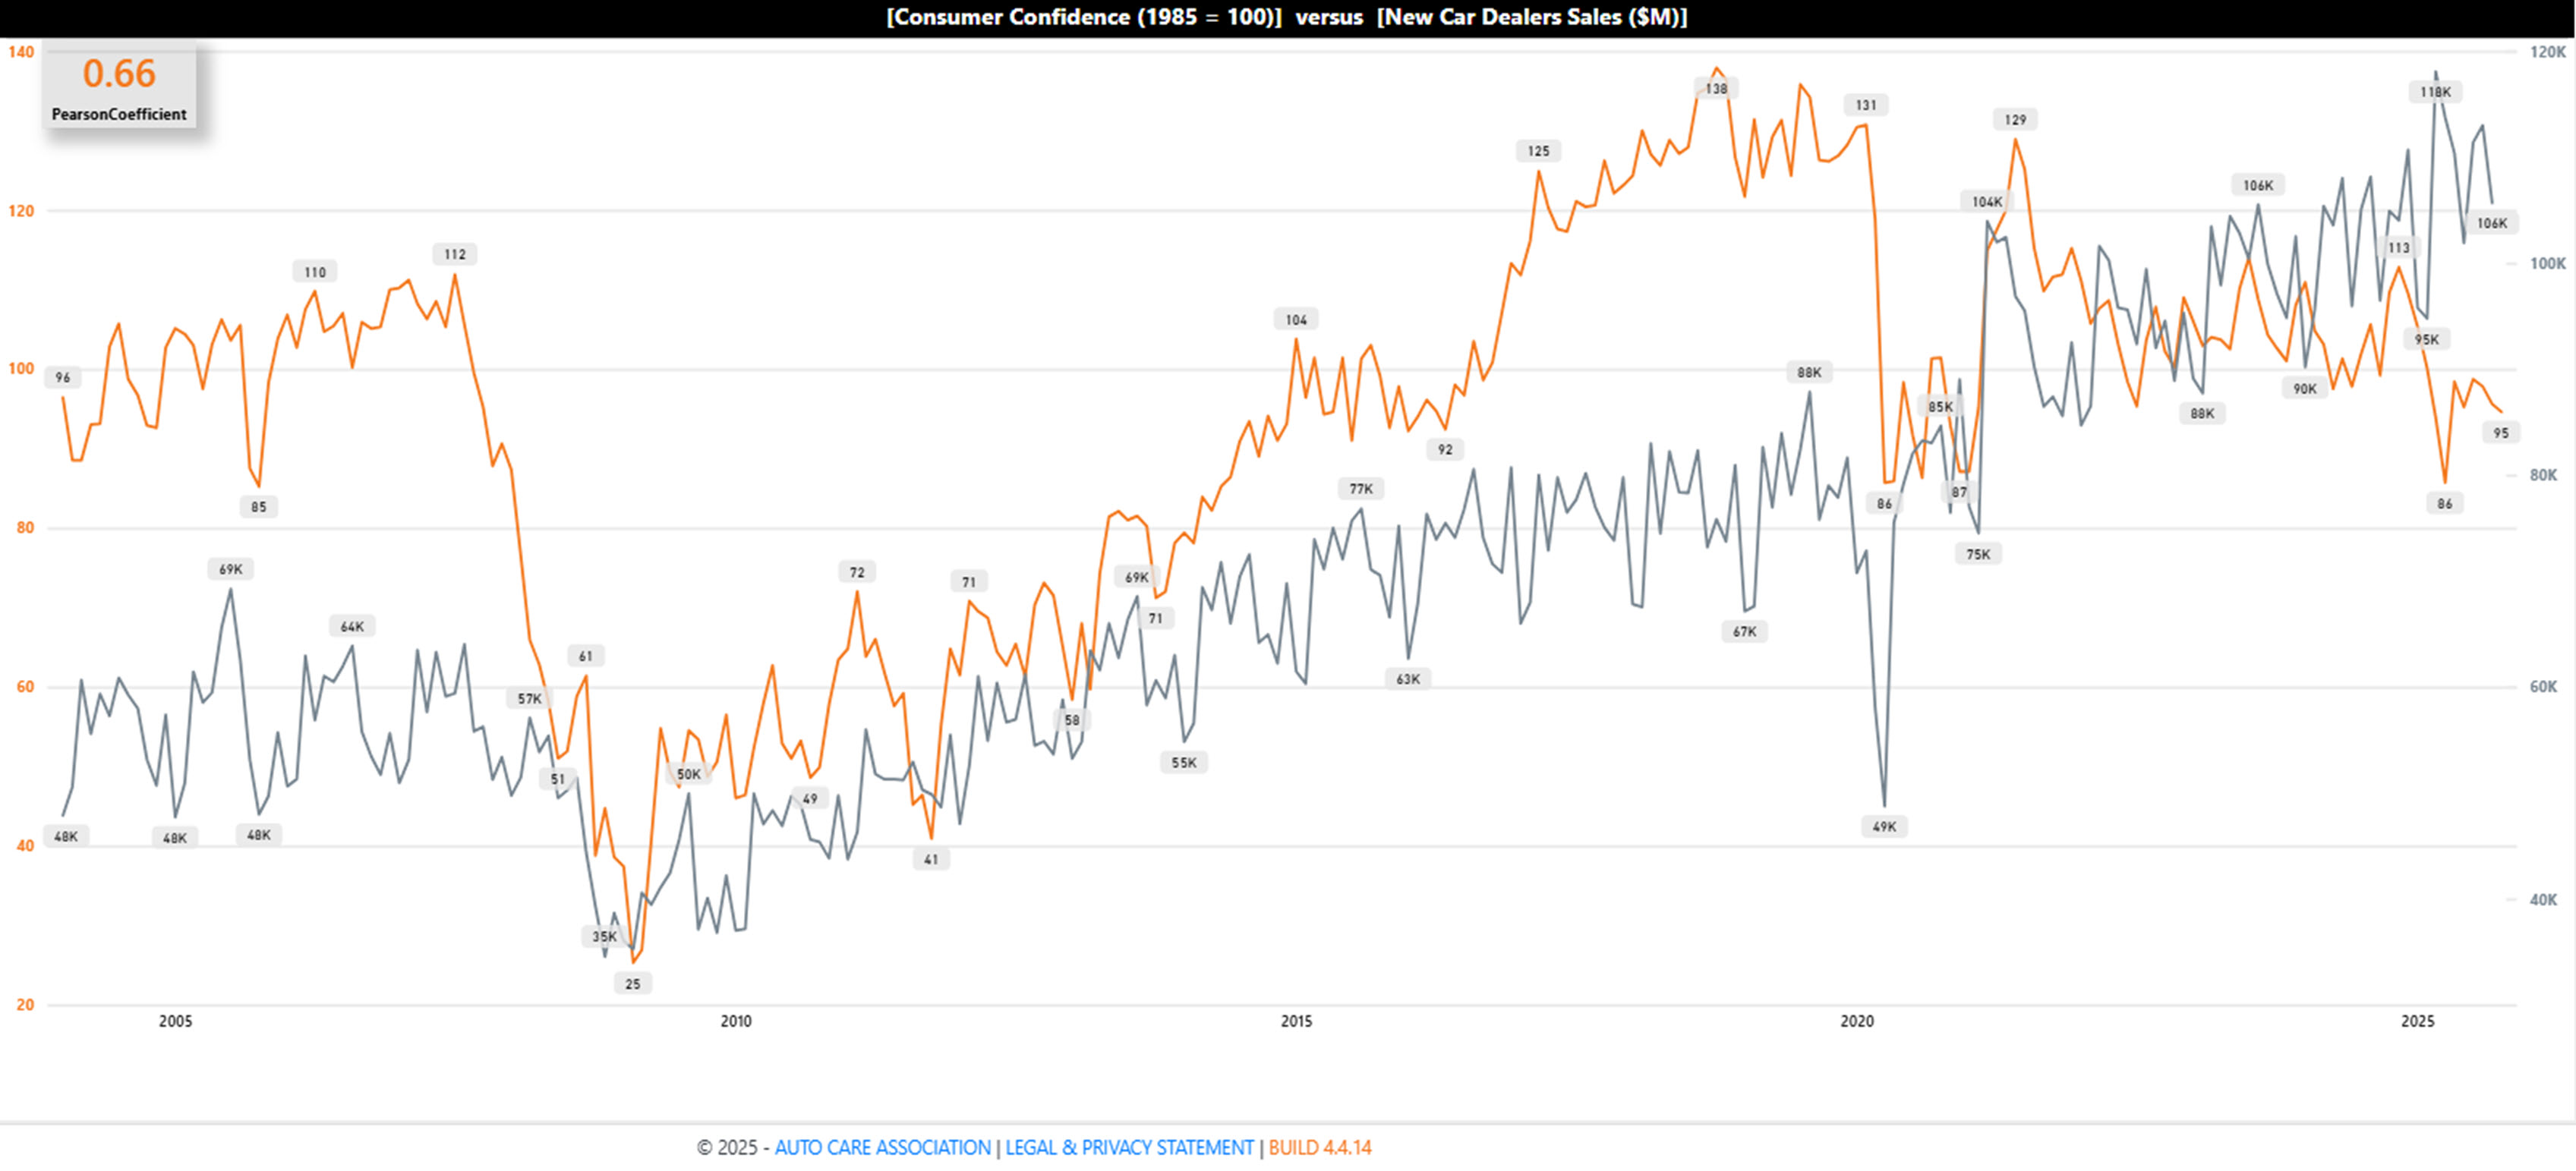
Taking in the long view – as in, from January 2004 – the four charts below track consumer confidence (orange line) relative to:
- New Car Dealers Sales ($)
- Used Car Dealers Sales ($)
- Light Truck Sales (units)
- Passenger Car Sales (units)
Figure 4: New Car Dealers Sales ($), r=0.66 |
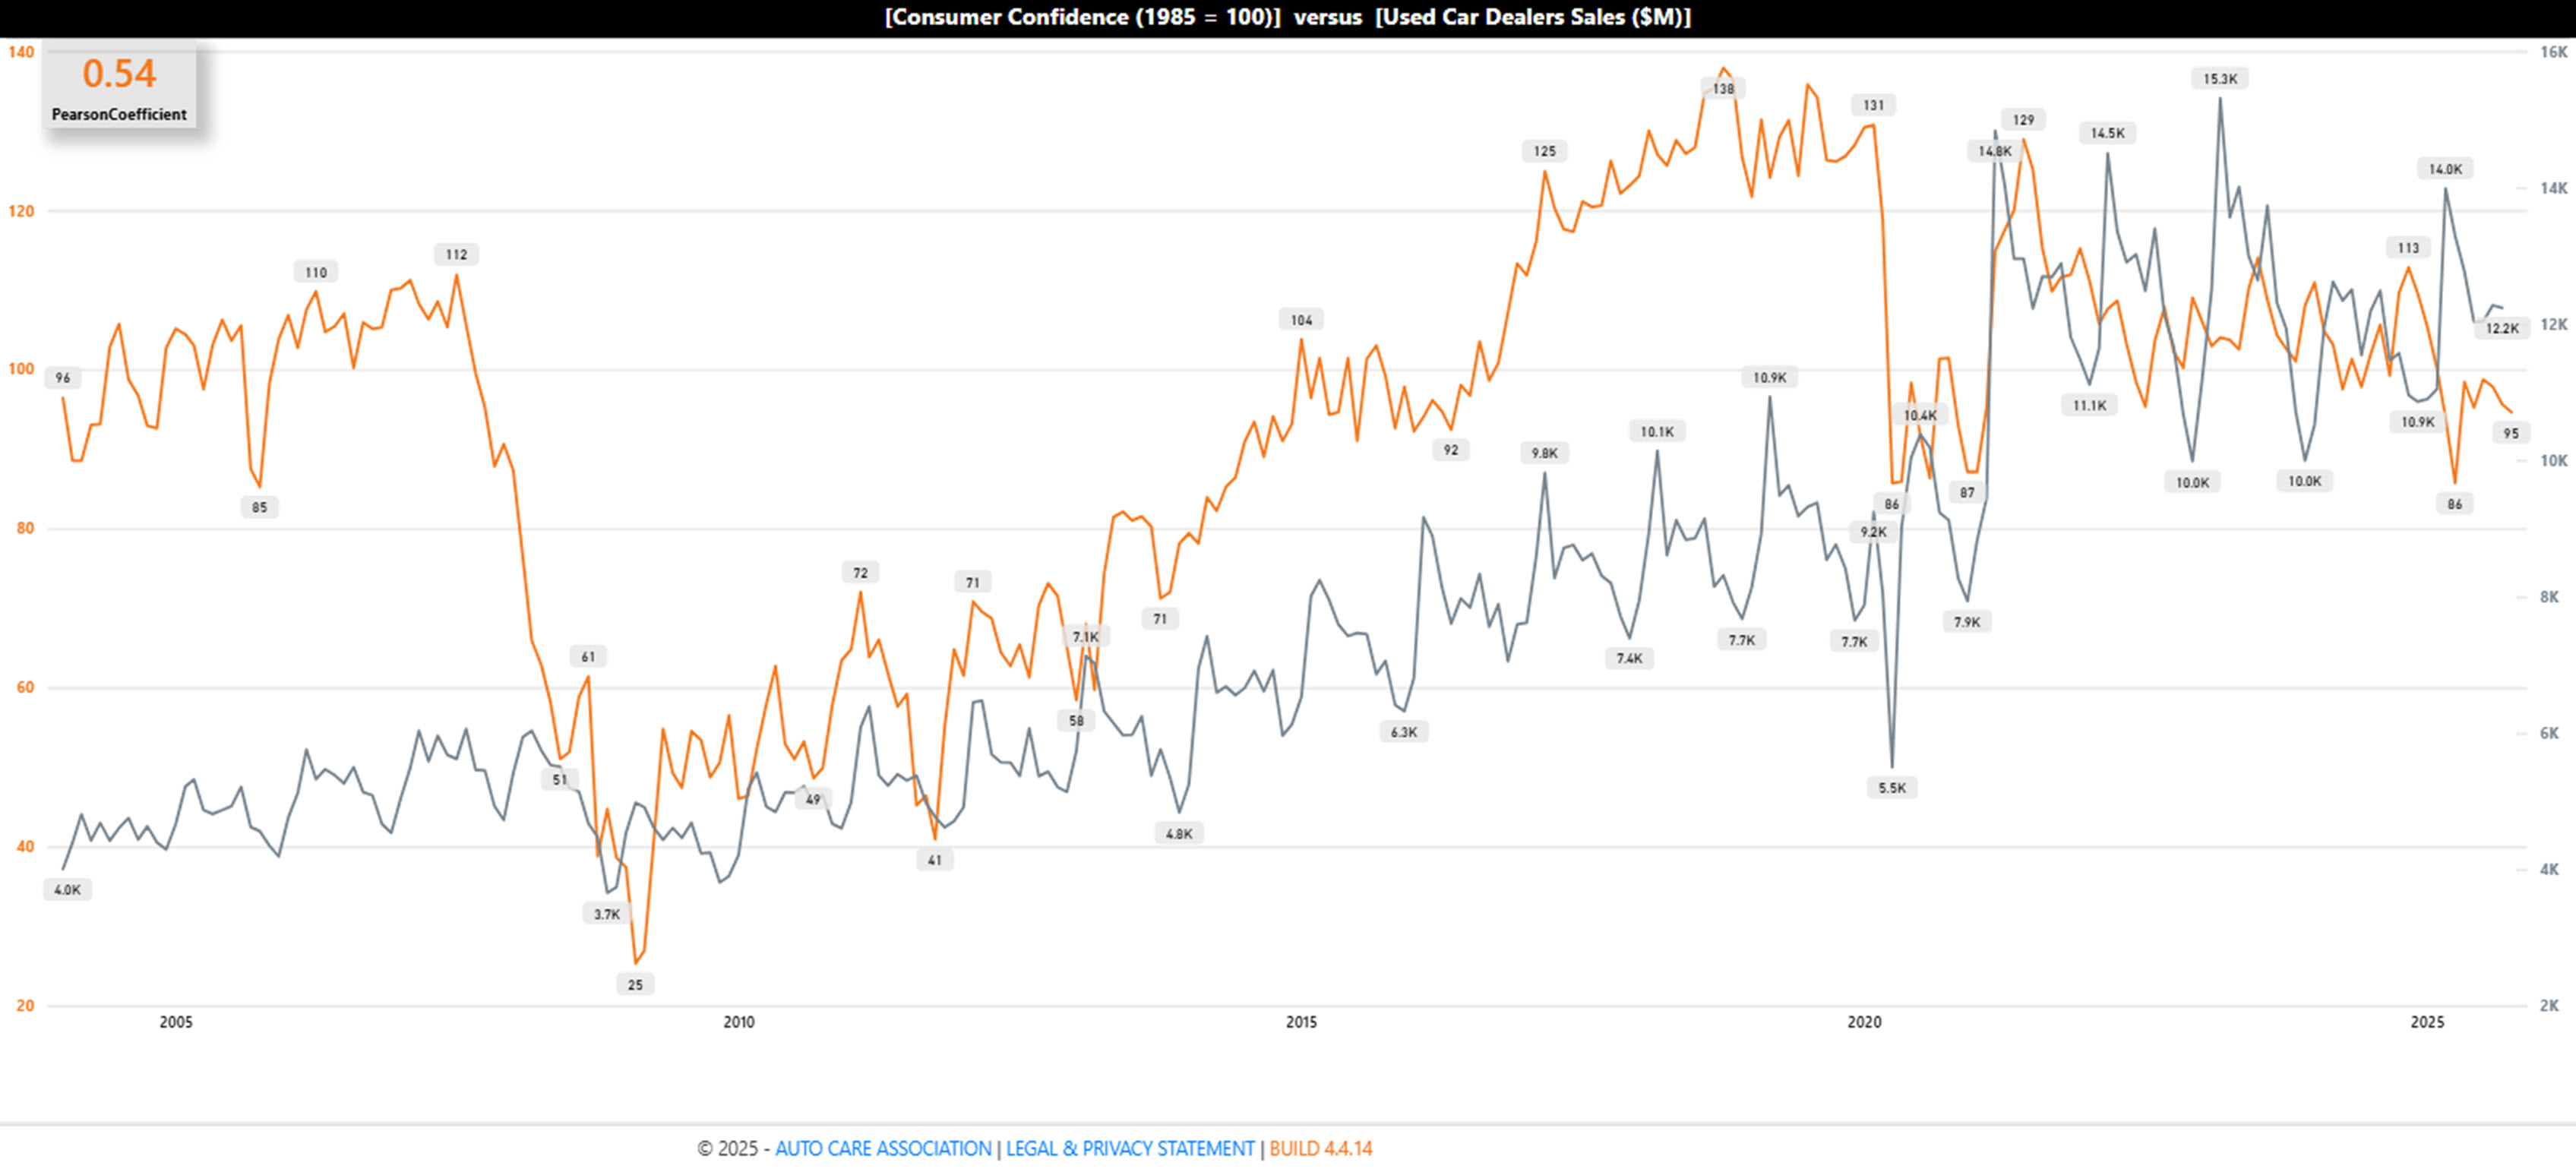
Figure 5: Used Car Dealers Sales ($), r=0.54 |
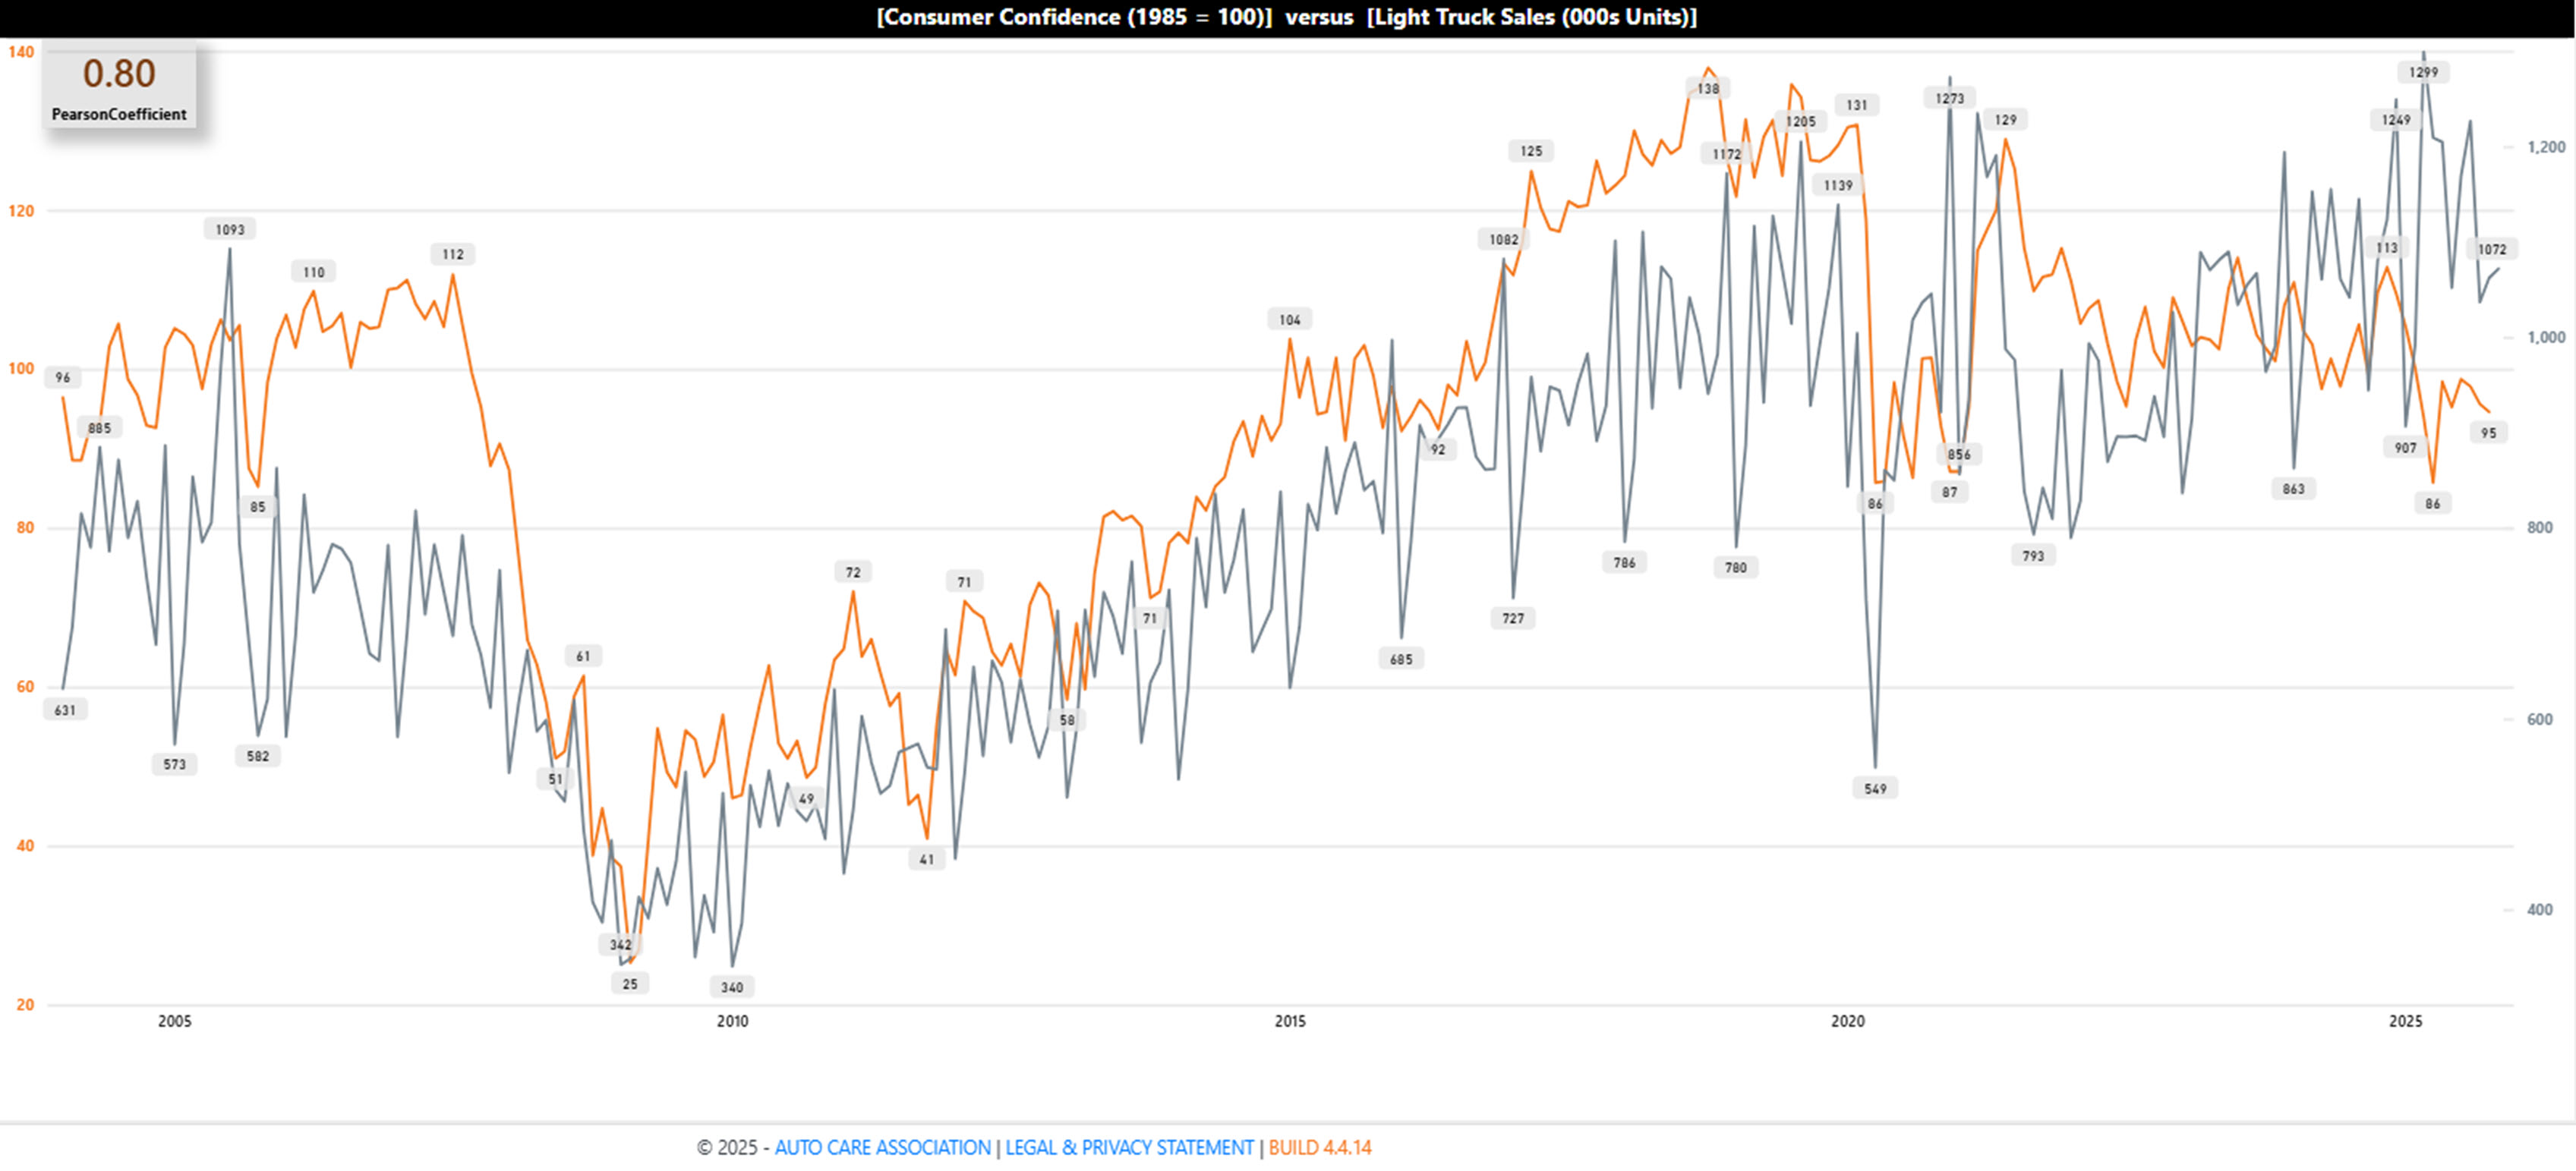
Figure 6: Light Truck Sales (units), r=0.80 |
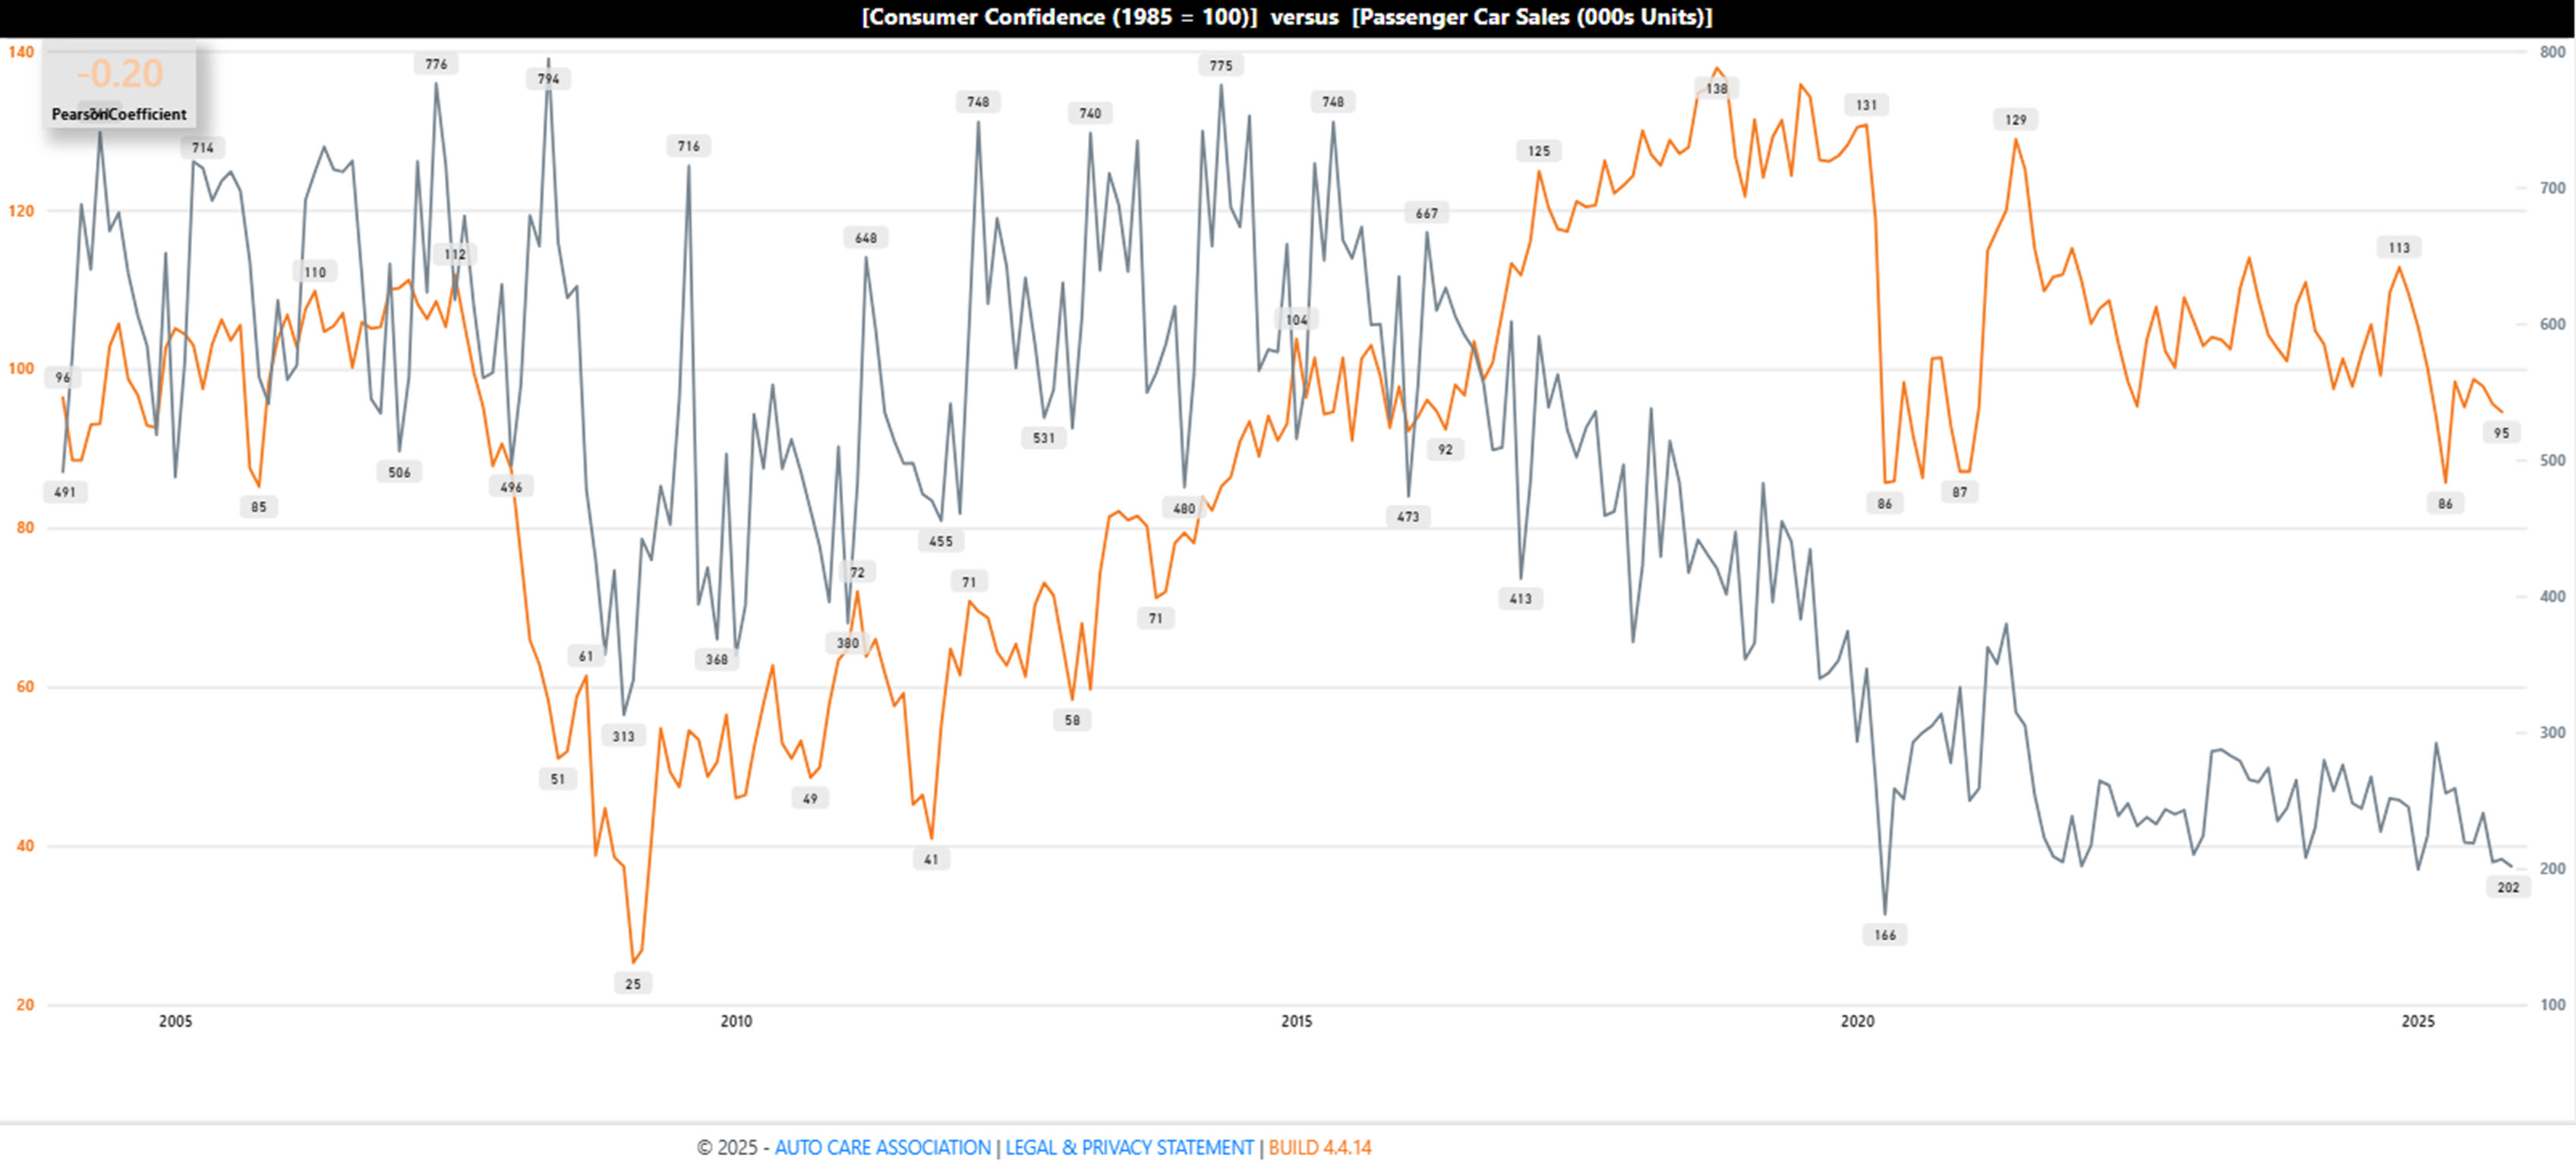
Figure 7: Passenger Car Sales (units), r= –0.20 |
Sources: TrendLens®, U.S. Bureau of Economic Analysis, U.S. Census Bureau, The Conference Board
Not surprisingly, consumer confidence is more highly correlated with new car dealer sales (Pearson Correlation Coefficient, r=0.66) than with used car dealer sales (r=0.54) – after all, consumers would have to be feeling pretty bullish to buy a new vehicle, particularly given high prices ($50,080 in September, according to Kelly Blue Book).
Interestingly, consumer confidence is more highly correlated with light truck sales (r=0.80). In fact, there is little correlation, if any, with passenger car sales (r= –0.20). Light truck sales now account for 81% of light vehicle registrations in the United States – 25 percent higher than in 2004 – charted below.
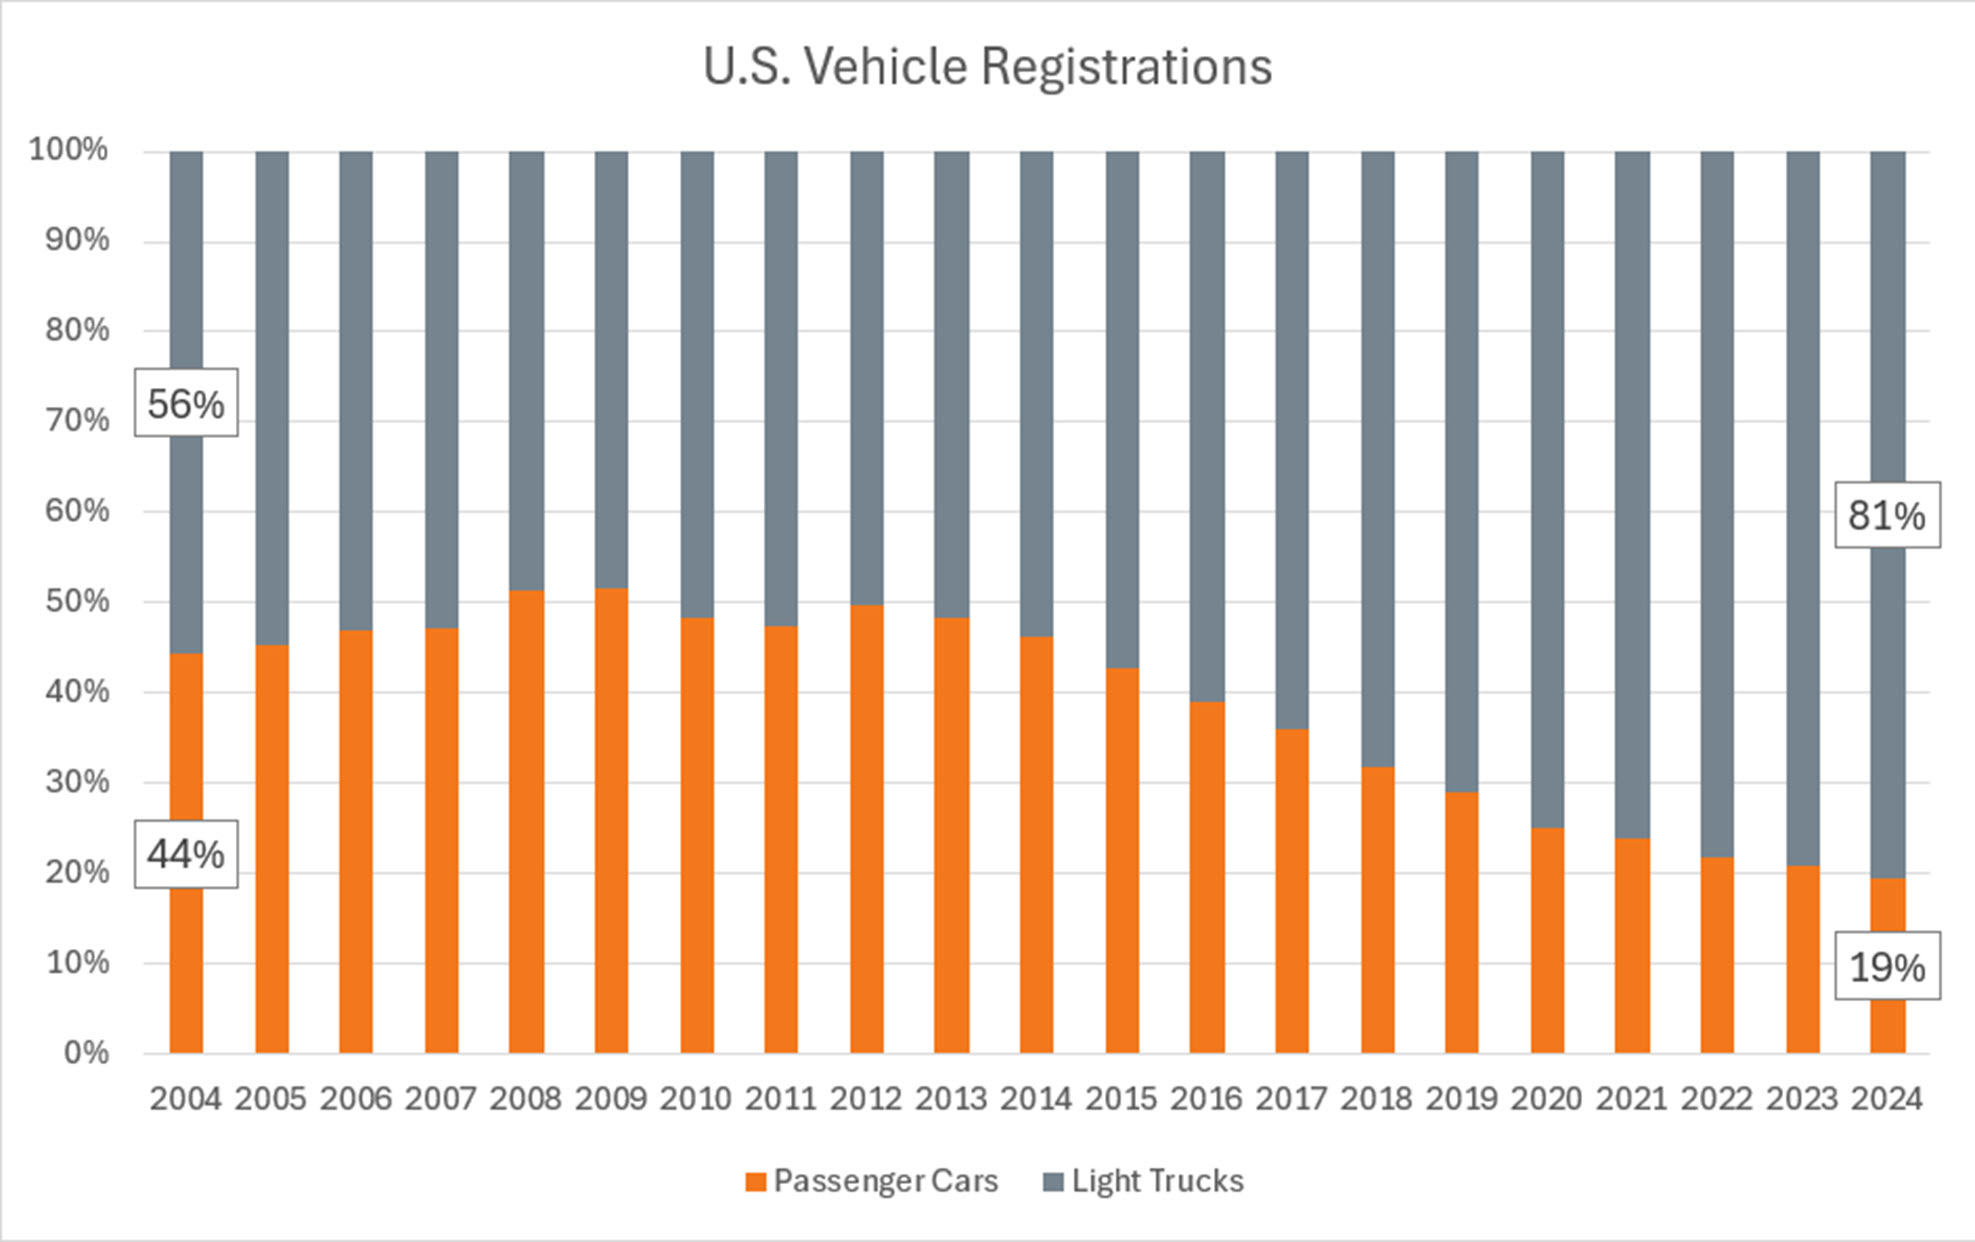
Figure 8: U.S. Vehicle Registrations, 2004-2024
Source: Auto Care Factbook, S&P Global Mobility
Steady Driving
Is total driving correlated with consumer confidence? Moderately – the Pearson correlation coefficient (r) is 0.39 for these data from 2004 (charted below). The seasonal trends are quite evident for vehicle miles traveled (VMT, blue-gray).
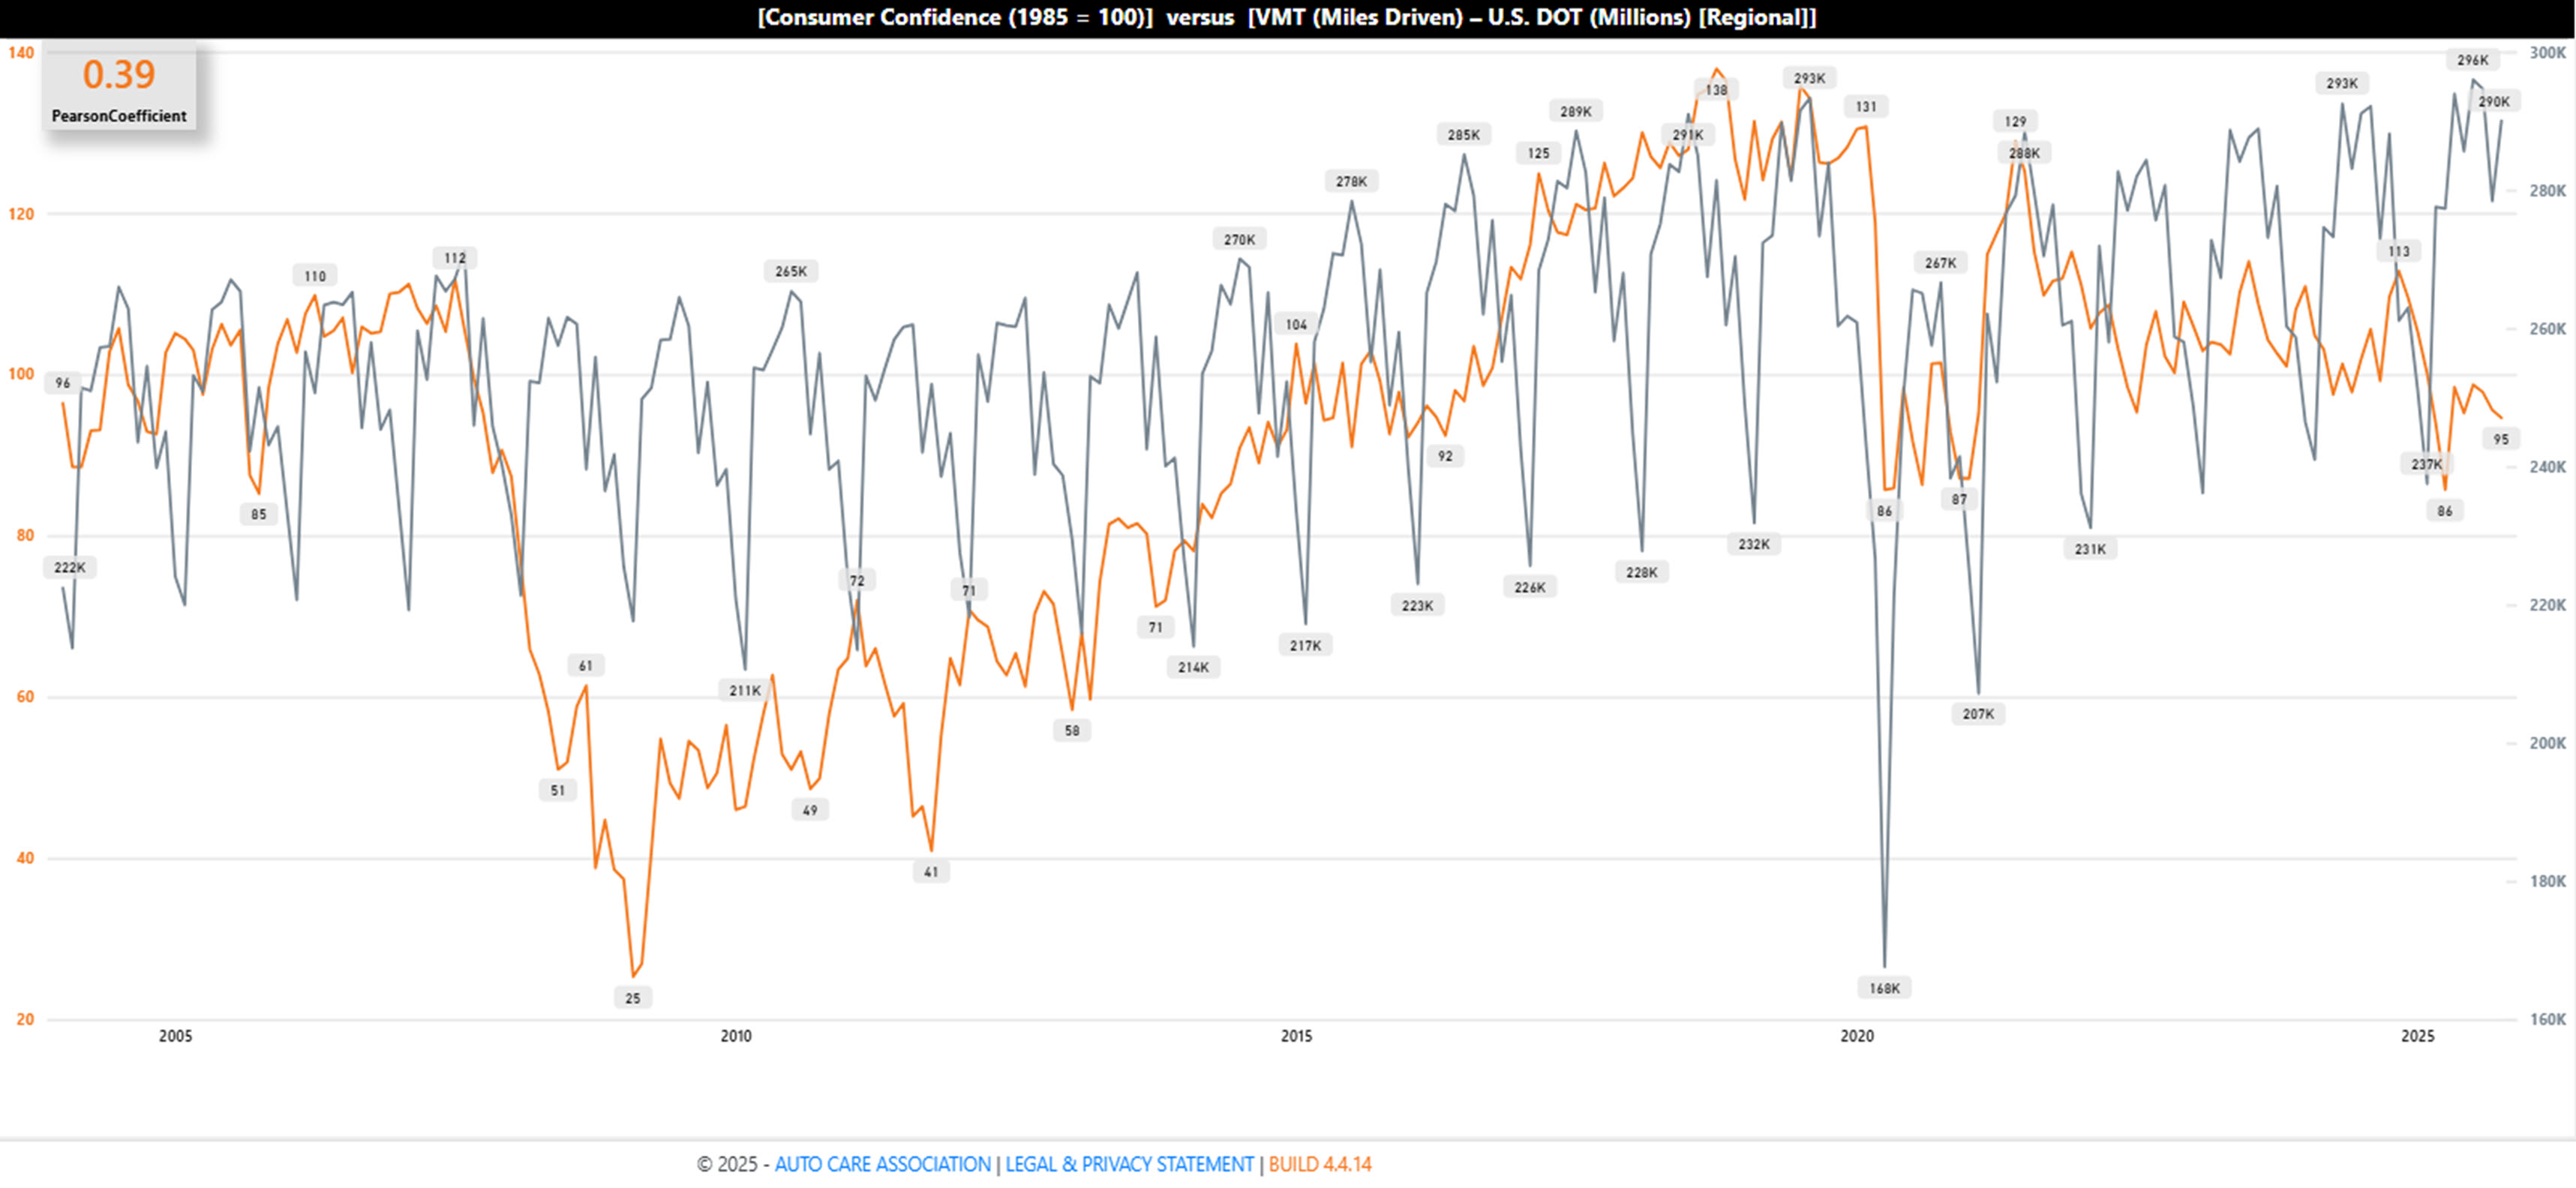
Figure 9: Consumer Confidence vs. Vehicle Miles Traveled
Sources: TrendLens®, U.S. Department of Transportation, The Conference Board
As charted from January 2019, Arity data confirms that at a high level, VMT has been stable since Spring 2022 – note that the year-over-year delta by month in the bottom portion is very stable.
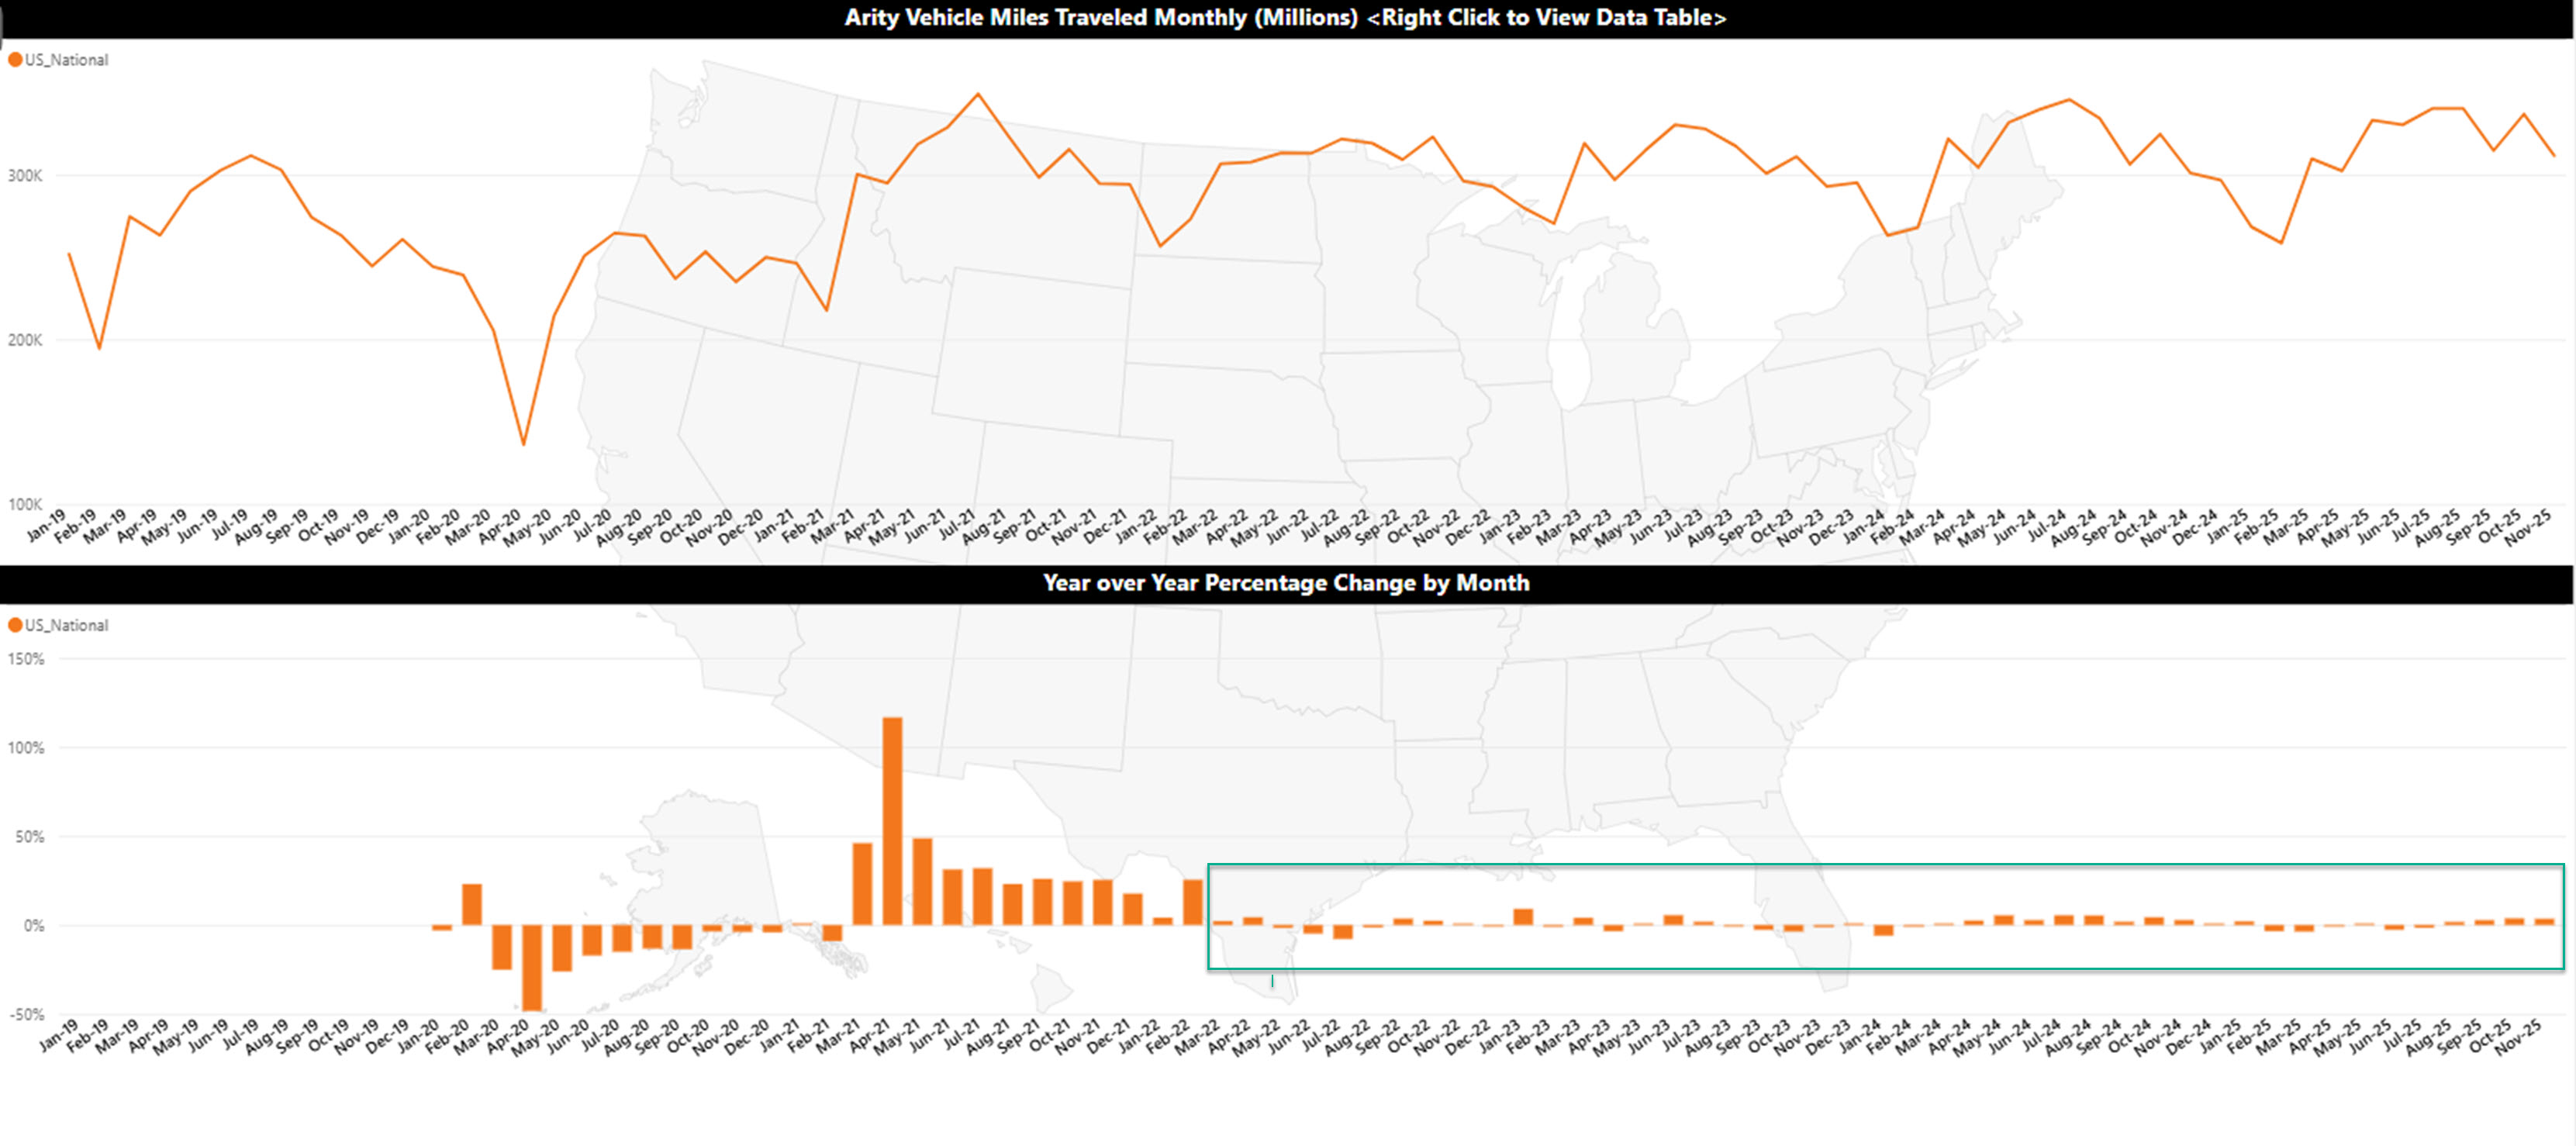
Figure 10: Arity VMT
Sources: TrendLens®, Arity
Part Selection Trends
About half of consumers (48%) have not changed the quality level of parts they have purchased in recent years (based on a survey of more than 500 individuals responsible for maintaining their household vehicles). Those opting for higher quality parts (42%) primarily did so for “better performance or improved vehicle handling (38%), “longer warranty or better coverage (36%), “desire for increased reliability and durability” (32%), and/or “safety concerns” (30%).
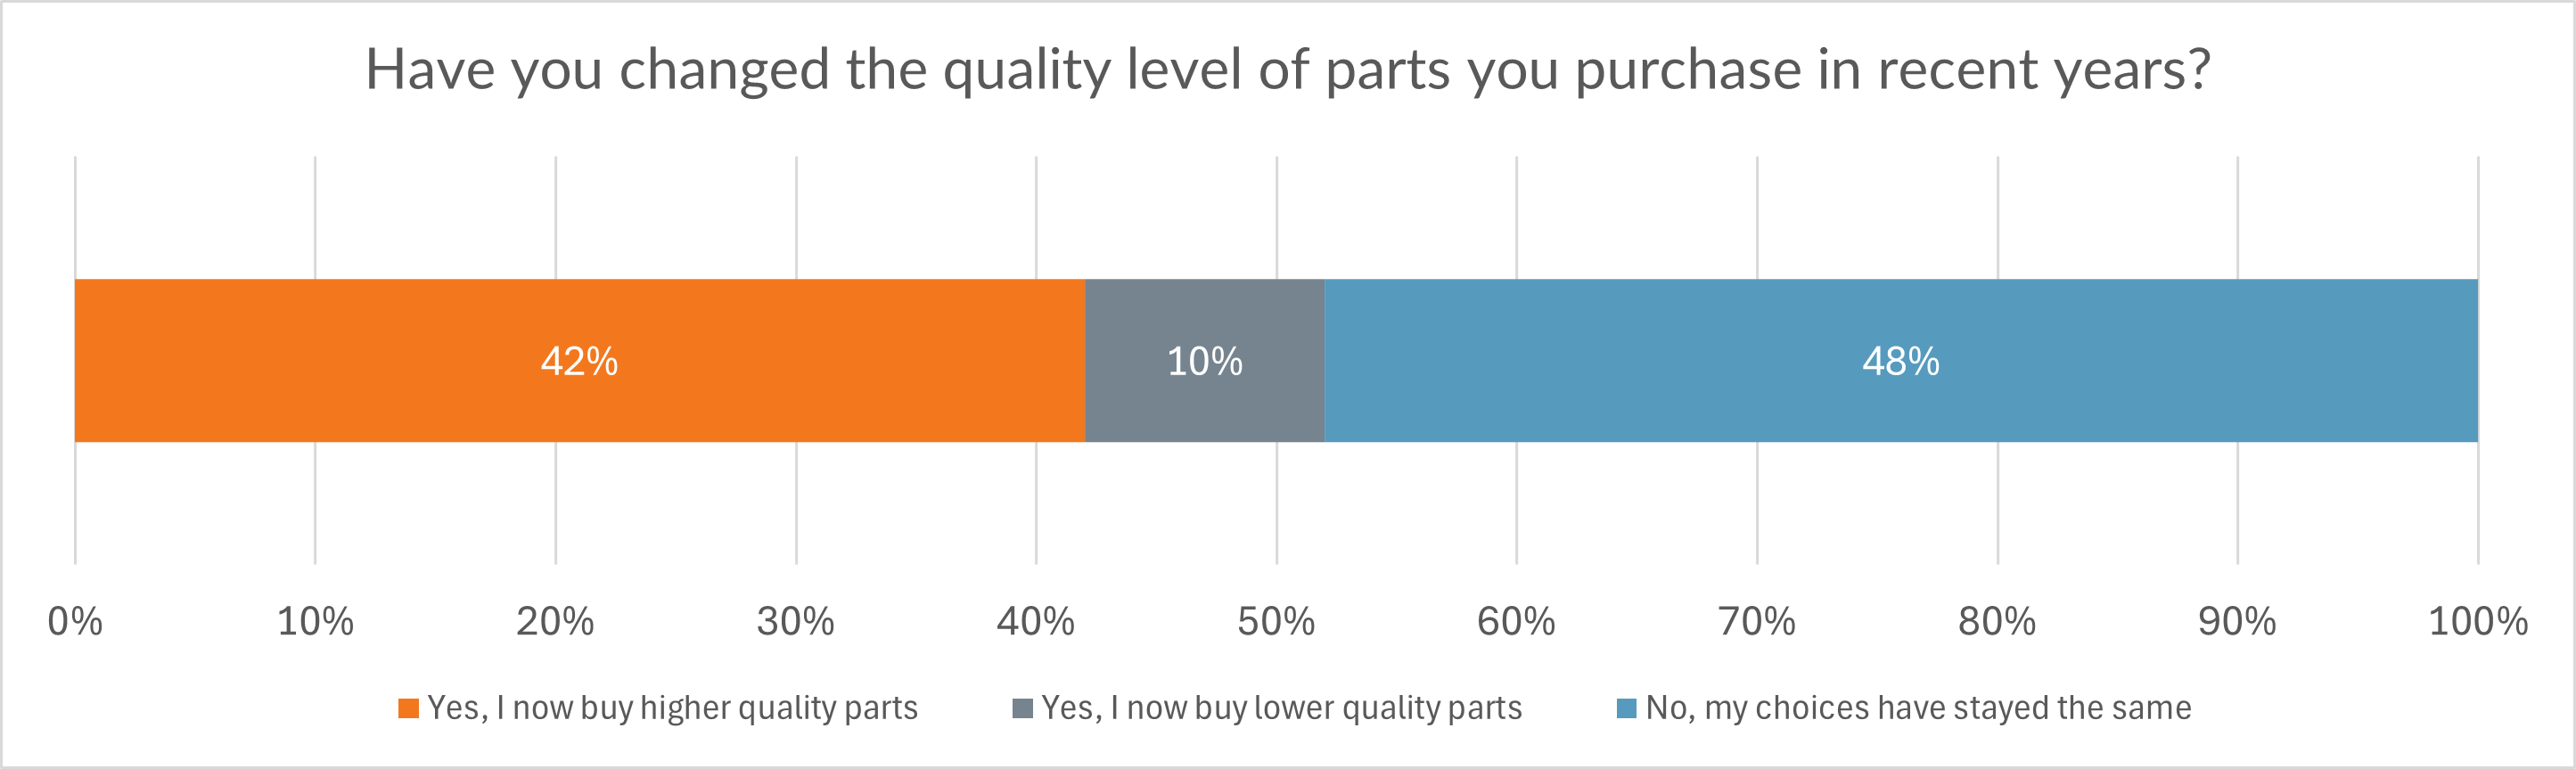
Figure 11: Quality of Parts Purchased
Source: Hanover Research survey of 514 U.S. residents responsible for vehicle maintenance/repair
Consumers with a newer vehicle (1-4 years old) are significantly more likely to choose higher quality parts (56%) than those with older vehicles. While not statistically significant, those with 10-14 year old vehicles or 15+ year old vehicles are less likely to choose higher quality parts (31% and 30%, respectively).
The 10% who purchase lower quality parts most commonly do so due to “budget constraints or need to save money” (35%), followed by “urgency – needed a part quickly and only lower quality was in stock” (25%), “vehicle is older or nearing end of life” (22%) and “satisfied with previous lower quality purchases” (22%).
EV Production Trends
[AKA More Support for the Internal Combustion Engine-Focused Aftermarket]
As reported in The Wall Street Journal, Ford Motor “has lost $13 billion on its EV [electric vehicle] business since 2023” and “would bolster its lineup of gas-powered vehicles while shifting to hybrid and so-called extended-range electric vehicles that include onboard gasoline engines" [2].
Earlier this year, General Motors “took a $1.6 billion special charge related to its EV pullback in the third quarter,” associated with stranded costs for a factory previously intended for EV production [3].
Our recent 2025 Joint Powertrain Trends & Outlook Forecast, released in November, illustrates the gap in EV availability and prices of purchased vehicles by U.S. consumers. The chart on the left shows the price ranges of vehicles purchased in 2023 while the chart on the right shows the price ranges of EVs purchased in 2024:
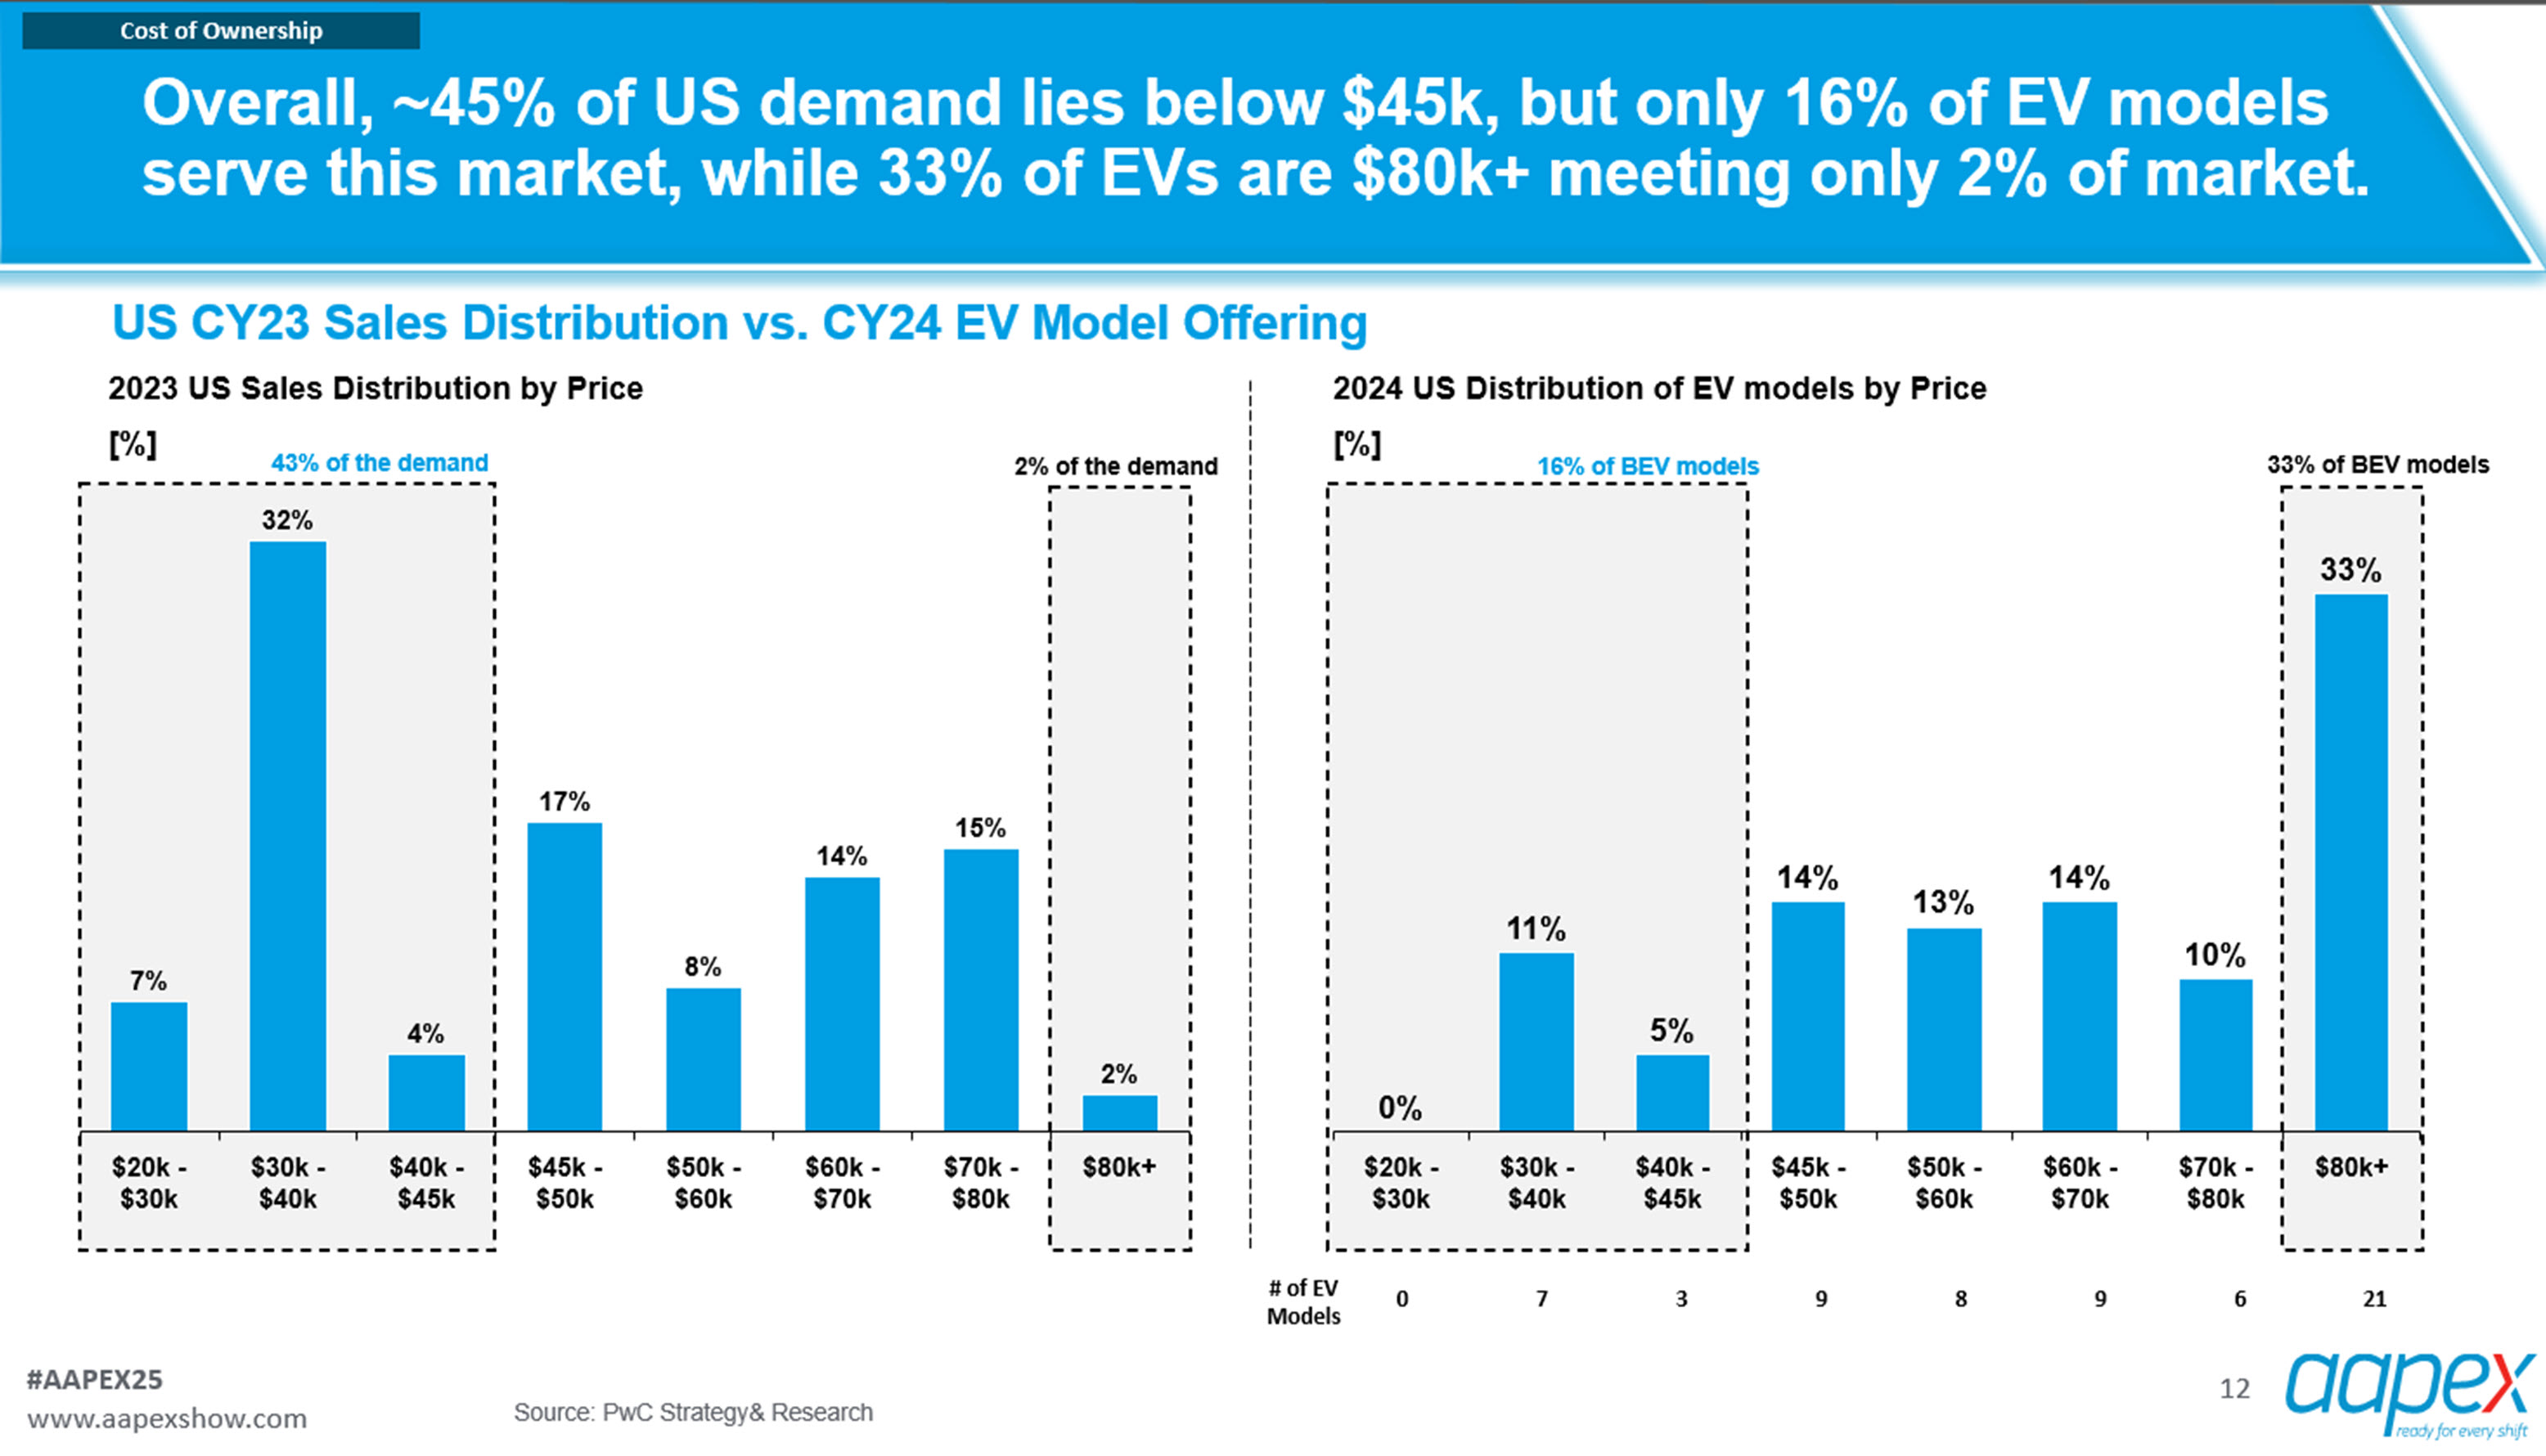
Figure 12: Price Ranges of Vehicles Sold vs. EVs Available
Source: Strategy &, a division of PwC, in association with Auto Care Association and MEMA: Joint Powertrain Trends and Outlook Forecast: 2025 Update
Looking Ahead
These are but a few of the trends we’ve observed and will continue to track in the new year. What will happen in 2026? I expect that the U.S. automotive aftermarket will continue to thrive and prosper, even amidst an uncertain and economically cloudy environment.
Best wishes to you all for a wonderful holiday season!
Endnotes:
R.L. Ensign, “White-Collar Workers Fear for Jobs”, The Wall Street Journal, Dec. 18, 2025.
S. Terlap, “Ford Takes $19.5 Billion Hit in Detroit’s Biggest EV Bust”, The Wall Street Journal, Dec. 15, 2025.
- C. Otts, “General Motors Lays Off More Than 3,300 Electric-Vehicle Workers in U.S. Plants”, The Wall Street Journal, Oct. 29, 2025.

Welcome to the new YANG Effect! Your one-stop quarterly newsletter for all things Automotive Aftermarket contributed to and written by under-40 industry professionals.
More posts

Market Insights with Mike is a series presented by the Auto Care Association's Director of Market Intelligence, Mike Chung, that is dedicated to analyzing market-influencing trends as they happen and their potential effects on your business and the auto care industry.
More posts